Click on an image to go directly to a system or scroll to see all of the systems in this gallery.
| OdeFactory Images and Annotations |
|
An OdeFactory Slide Show
Click on a slide to zoom in.
Click "video" to see a video. |
View/Sys/Gal: Ode " Fractal Centers" in "FractalCenters."
Range: (vMax,vMin) = (5.000,-5.000), (hMin,hMax) = (-5.000,5.000)
VFld: (0) Fractal Centers Call a point a fractal center, fc for short, if it is the center of a fractal. The classic z <- z^n+c EMap fractals in gallery ClassicFractals are generated by smooth vector fields. They generally have a prisoner set with a periodic attractor. The Sierpinski gasket and the Barnsley fern are IMap fractals generated by probabilistic vector fields. In the case of the z <- z^n+c fractals all points on the boundary of the prisoner set are fractal centers. For the probabilistic IMap fractals, all points on the image are fractal centers. The fractals discussed in gallery ClassicFractals have an infinite number of fractal centers. The following four EMap fractals, which differ only in parameter values, have a small number of fractal centers and no prisoner sets. They are derived from the 4-parameter locally nonsmooth system "EMapCT2 16.1" in ArtGallery: x <- (1+s*.1)*(y-step(x)*cos(b*x-c)), y <- (1+s*.05)*(a-x), and they have 1, 4, or 8 fractal centers. The last system is "NonSmoothExs: ( 6d) painting by the numbers, EMapMaxCT1" which was first discussed in gallery "PlottingCurves." It is defined by: x <- (1+.1*s)*(y-sgn(x)*sqrt(abs(b%x-c))), y <- (1+.1*s)*(a-x%d). It has 18 fcs arranged in 3 main clusters of 6 fcs each. Each cluster has a central fc, three larger outer satellite fcs and two smaller satellite clusters.
|
|
|
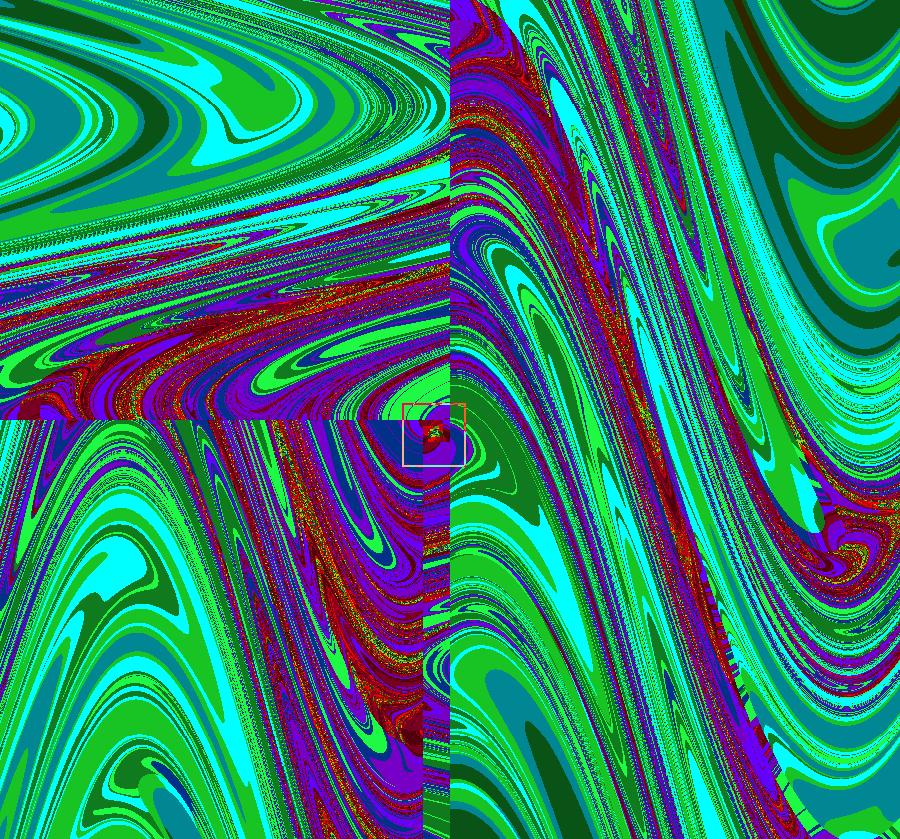
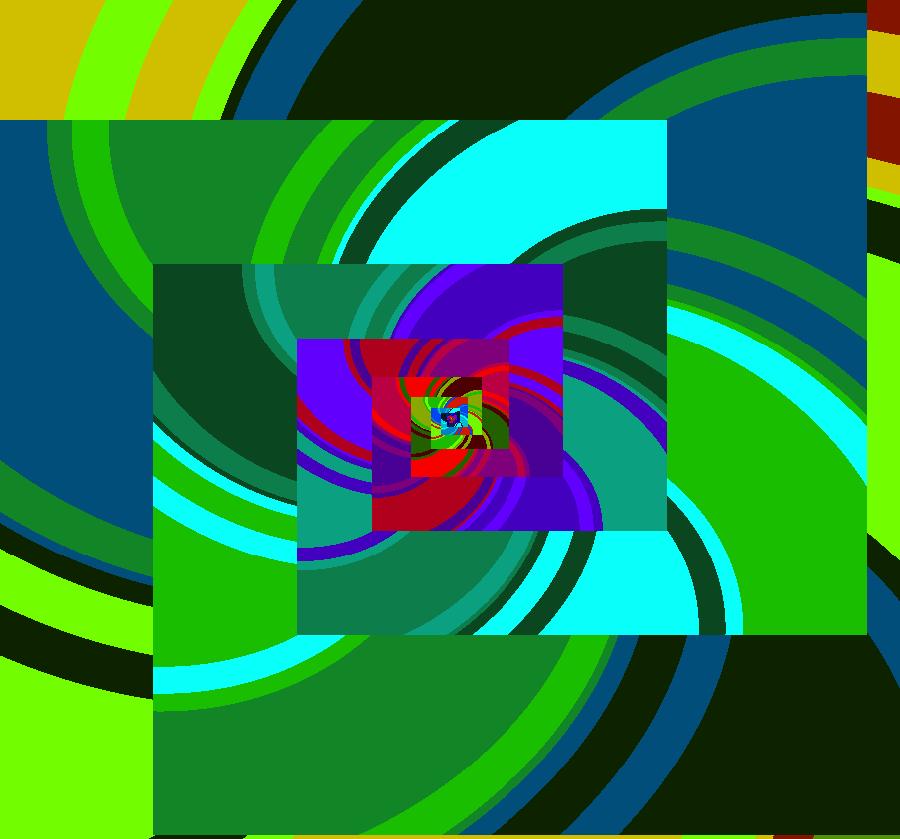
View/Sys/Gal: EMap " 1 fc, EMapCT2" in "FractalCenters."
Range: (vMax,vMin) = (-0.024,-0.035), (hMin,hMax) = (-0.042,-0.031)
VFld: ((1+s*.1)*(y-step(x)*cos(b*x-c)),(1+s*.05)*(a-x)), a = -.0630; b = 3.6000; c = .1000; s = 2.4000; This iteration is defined by: x <- (1+s*.1)*(y-step(x)*cos(b*x-c)), y <- (1+s*.05)*(a-x). Parameters are: a = -.063; b = 3.6; c = .1; s = 2.4; EMap CT: 2 fc ~ (-.036,-.031) This gives a spiral of rectangles containing curves, centered near (-.036,-.031) in a sea of chaos. Image 0: centered at fc Image 1: zoomed in at fc
|
|
|
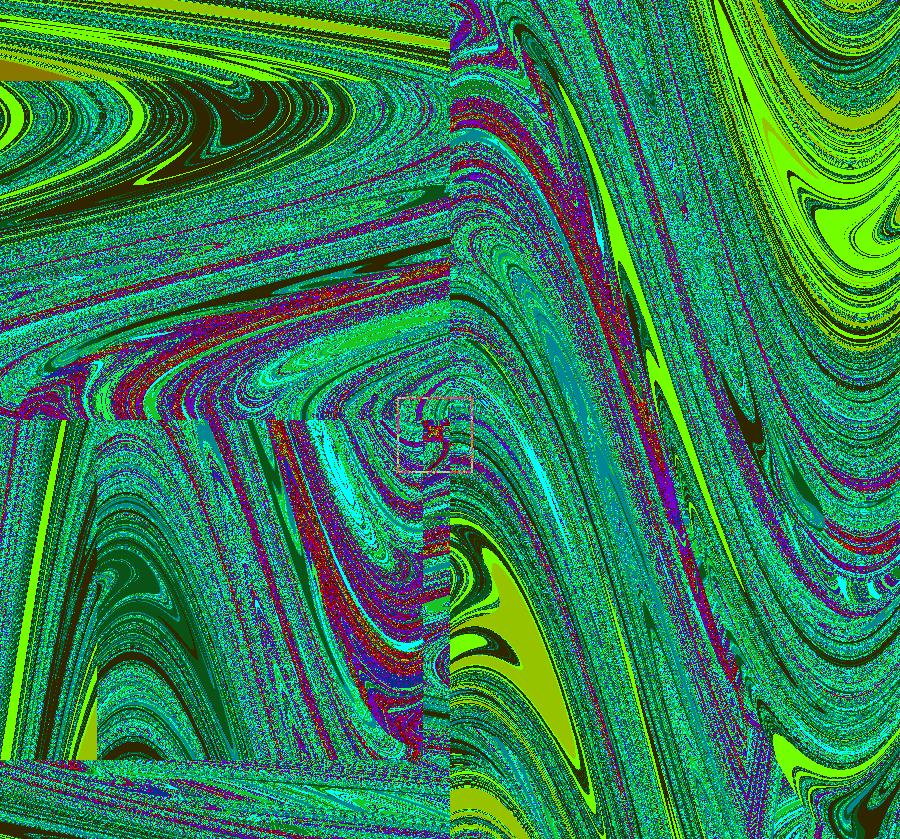
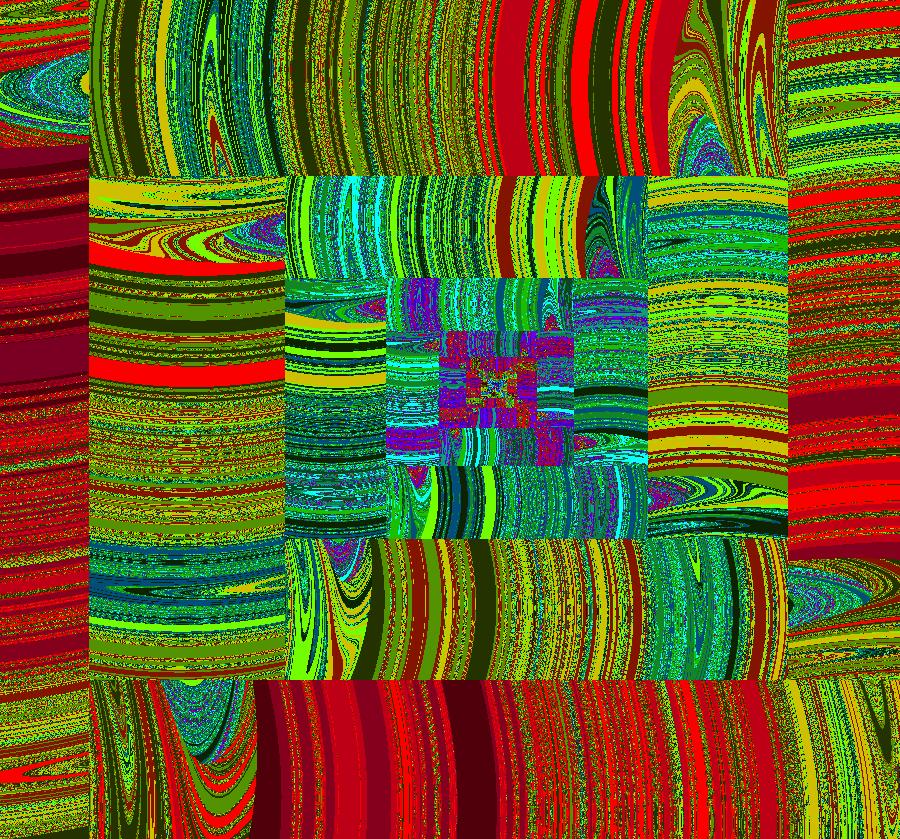
View/Sys/Gal: EMap " 1 fc, EMapCT2 more chaos" in "FractalCenters."
Range: (vMax,vMin) = (-0.022,-0.038), (hMin,hMax) = (-0.045,-0.030)
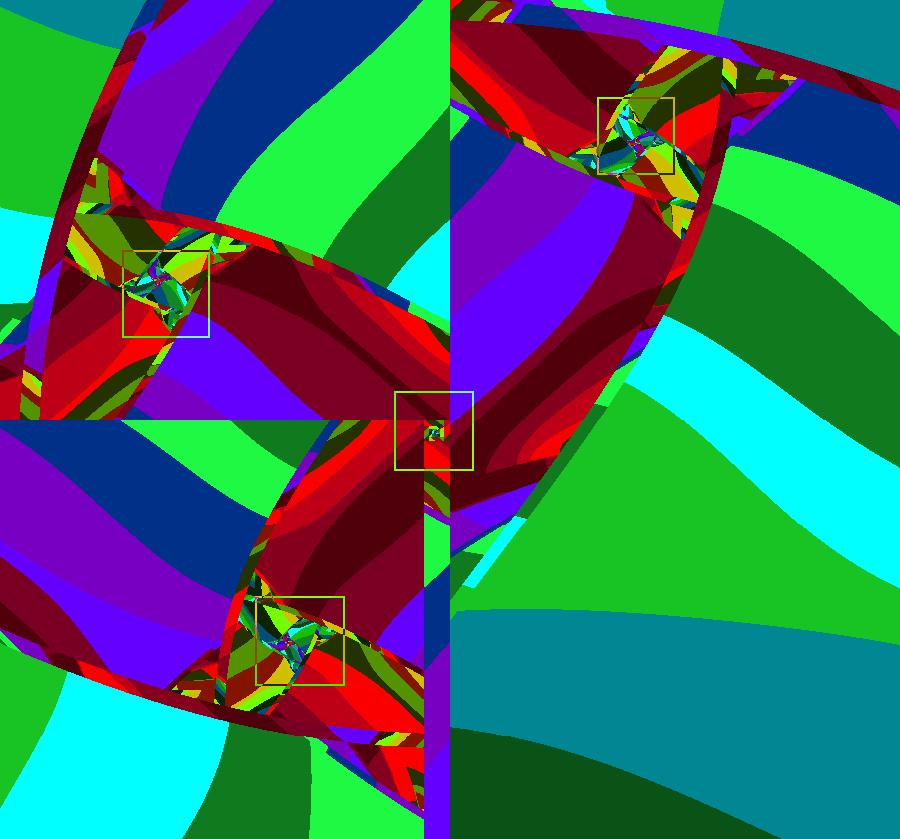
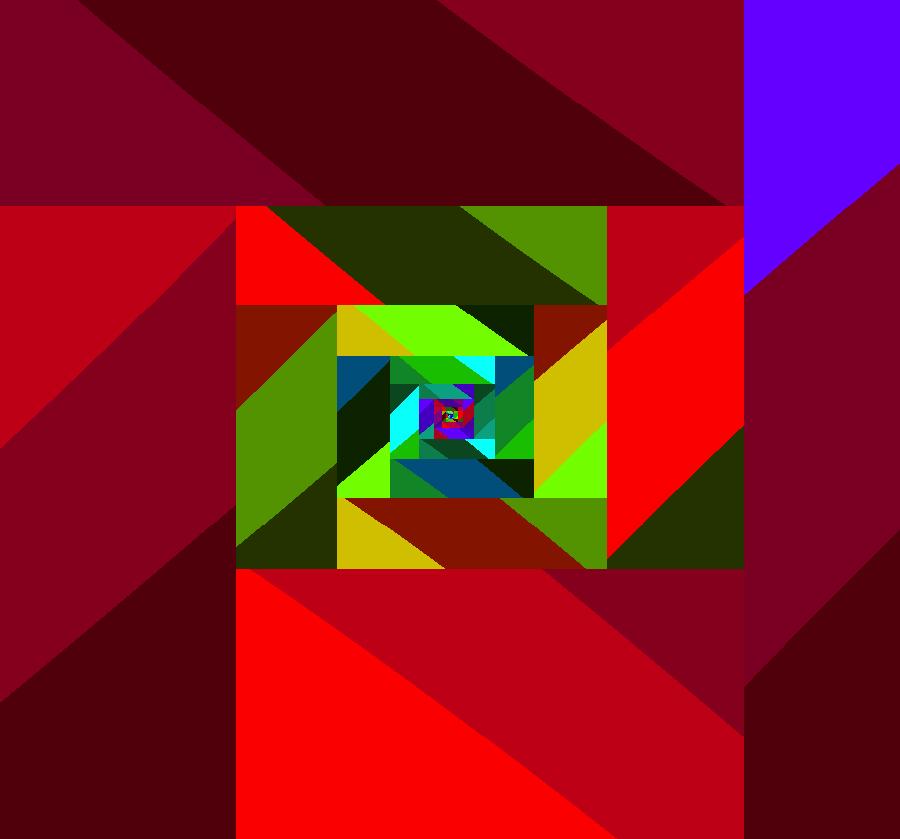
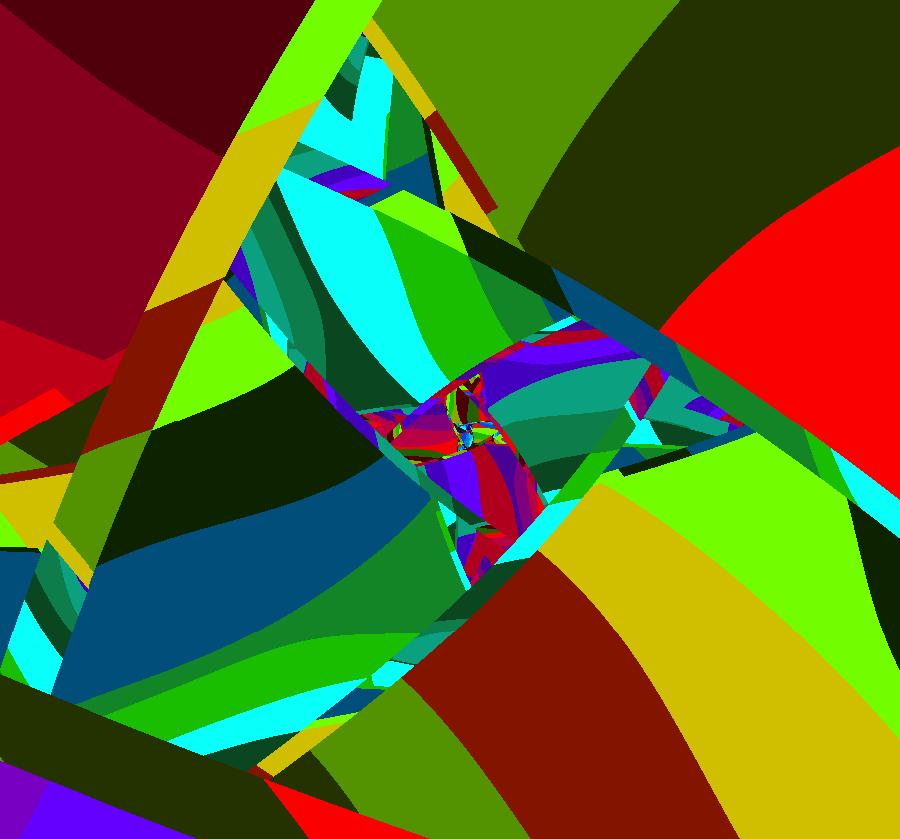
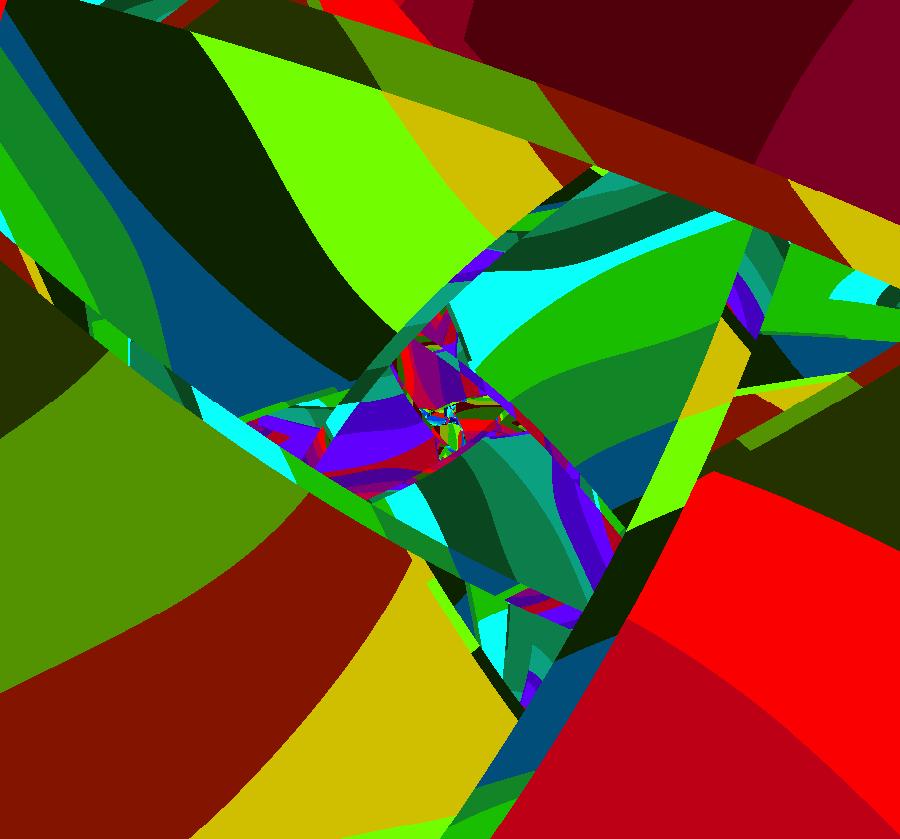
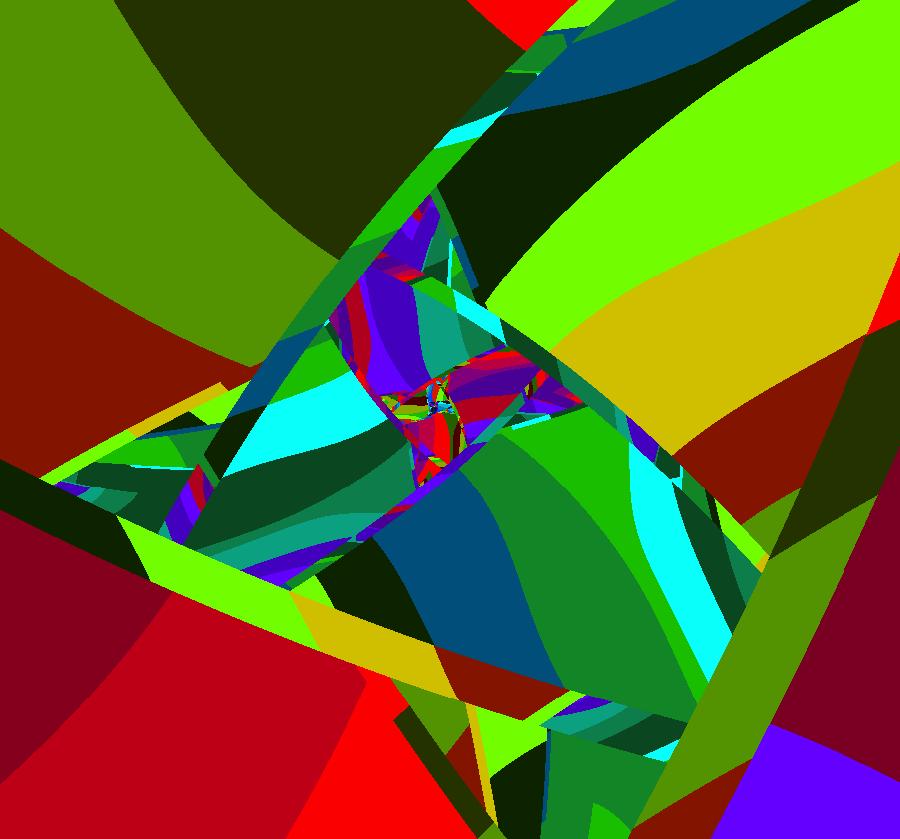
VFld: ((1+s*.1)*(y-ceil(x)*cos(b*x-c)),(1+s*.05)*(a-x)), a = -.0630; b = 3.6000; c = .1000; s = 2.4000; This iteration is defined by: x <- (1+s*.1)*(y-ceil(x)*cos(b*x-c)), y <- (1+s*.05)*(a-x). Parameters are: a = -.0630; b = 3.6000; c = .1000; s = 2.4000; EMap CT: 2 Here step(x) has been replaced in the first system by ceil(x). We still get a fractal center near (0,0) but there is much more chaos. fc ~ (-0.0366269,-0.0295379). Image 0: zoomed out. Image 1: zoomed in at fc.
|
|
|
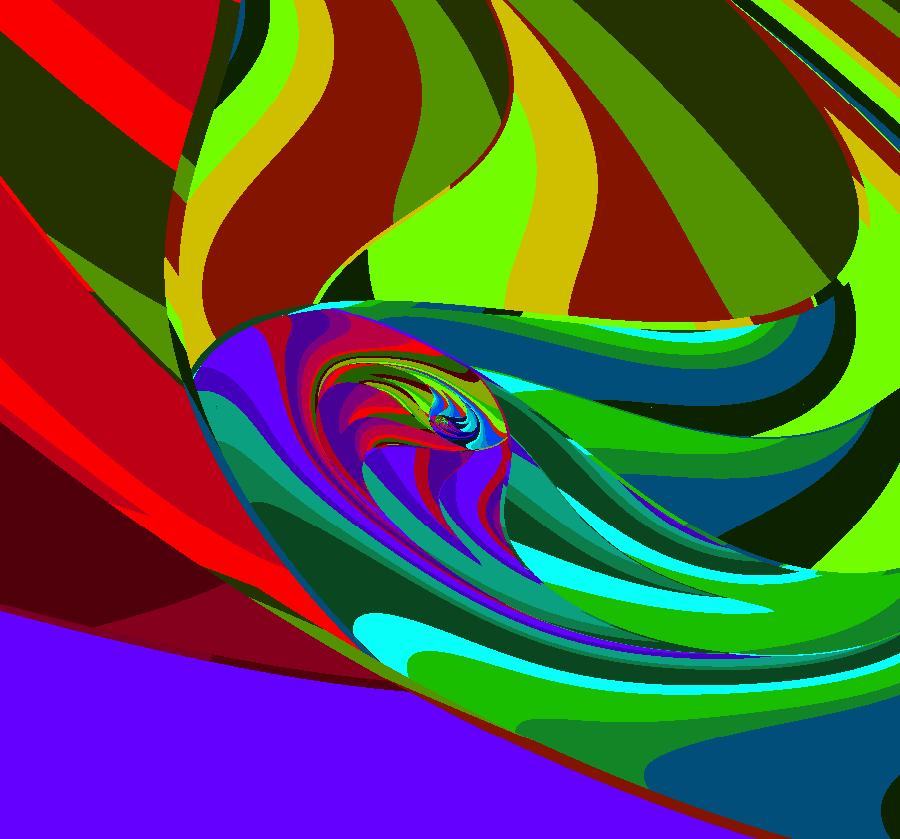
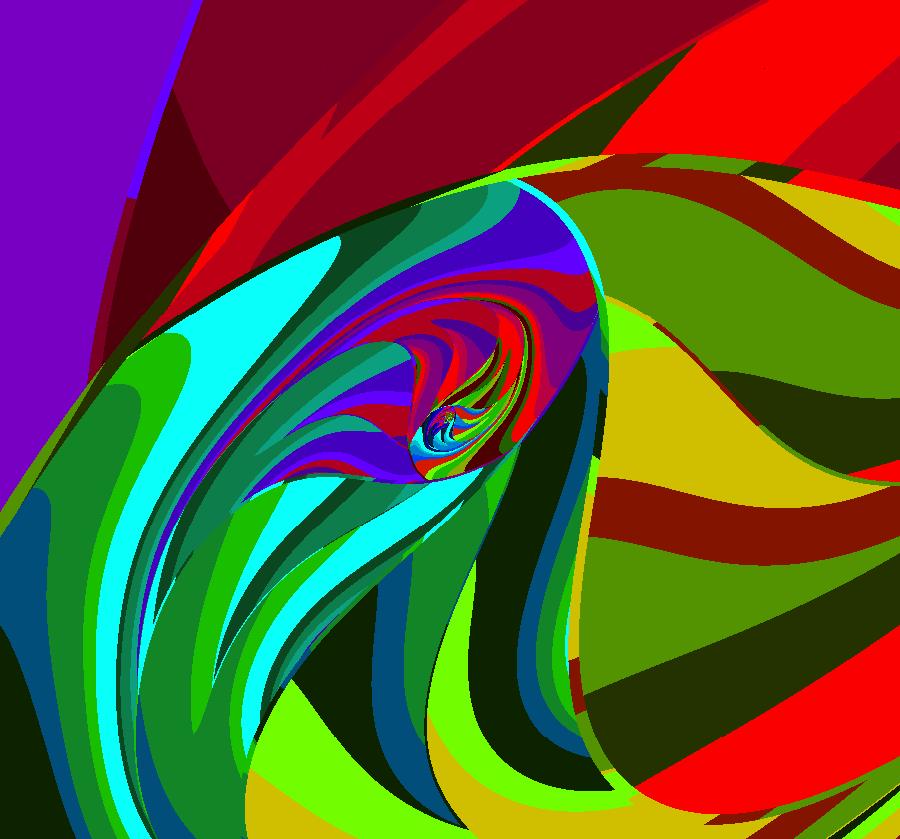
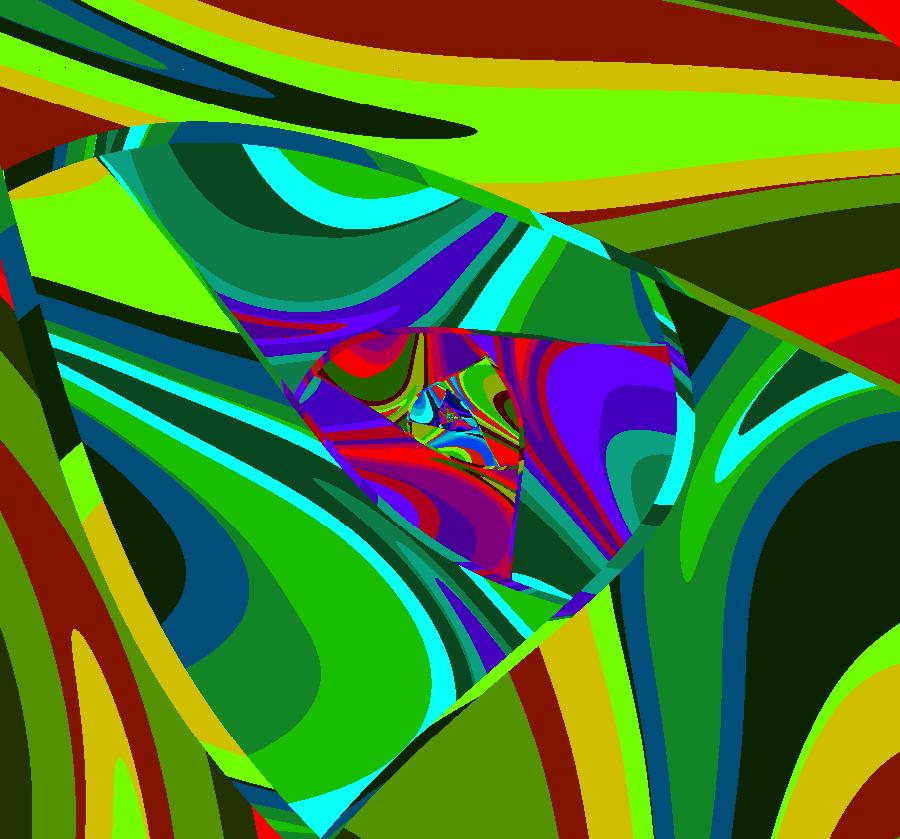
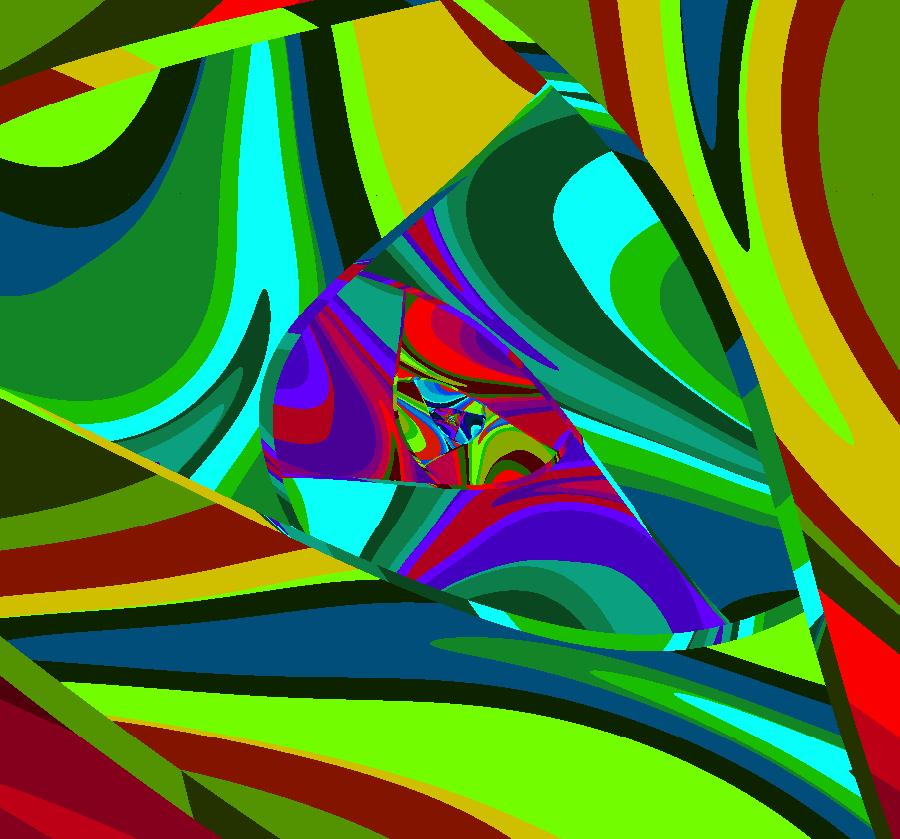
View/Sys/Gal: EMap " 4 fcs, EMapCT2" in "FractalCenters."
Range: (vMax,vMin) = (0.433,0.233), (hMin,hMax) = (-0.746,-0.546)
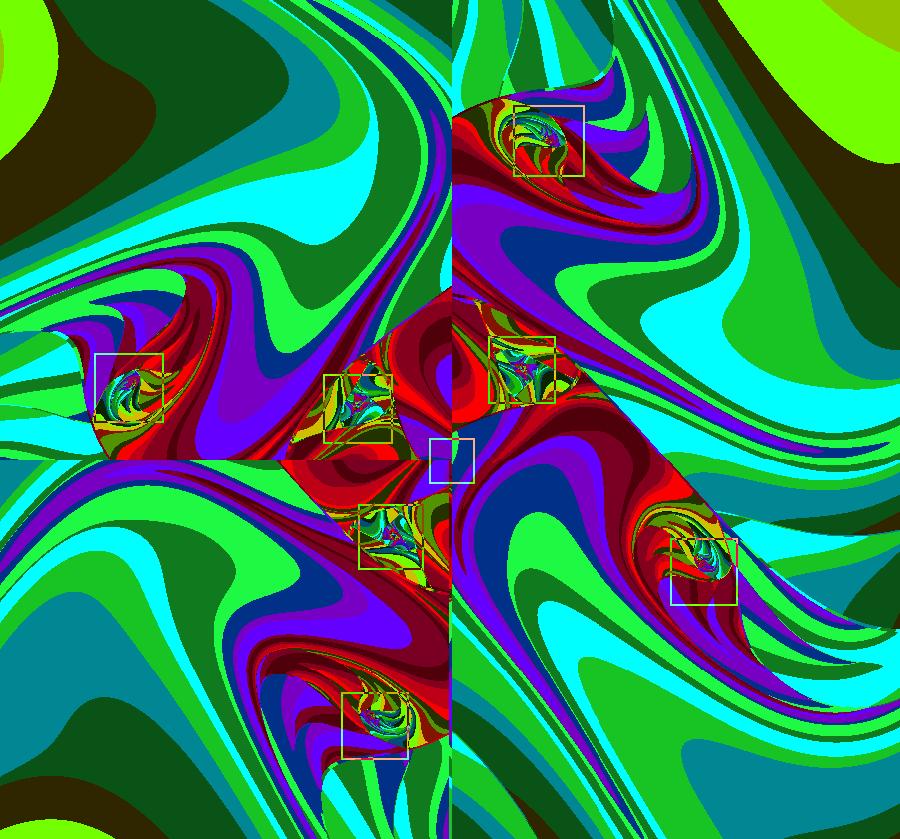
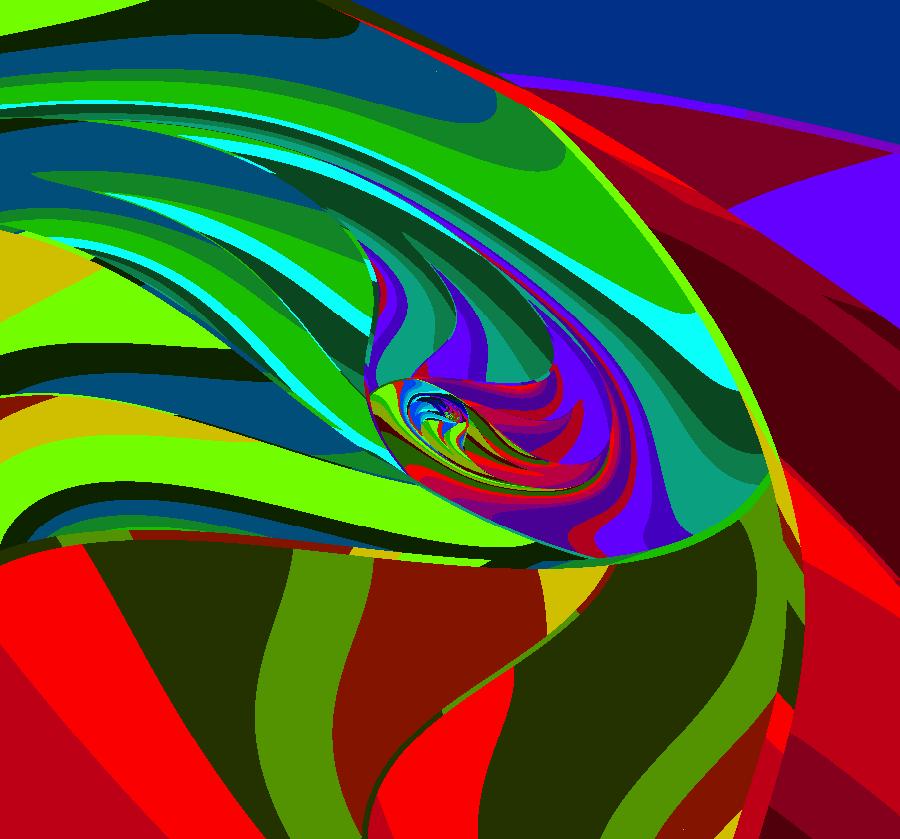
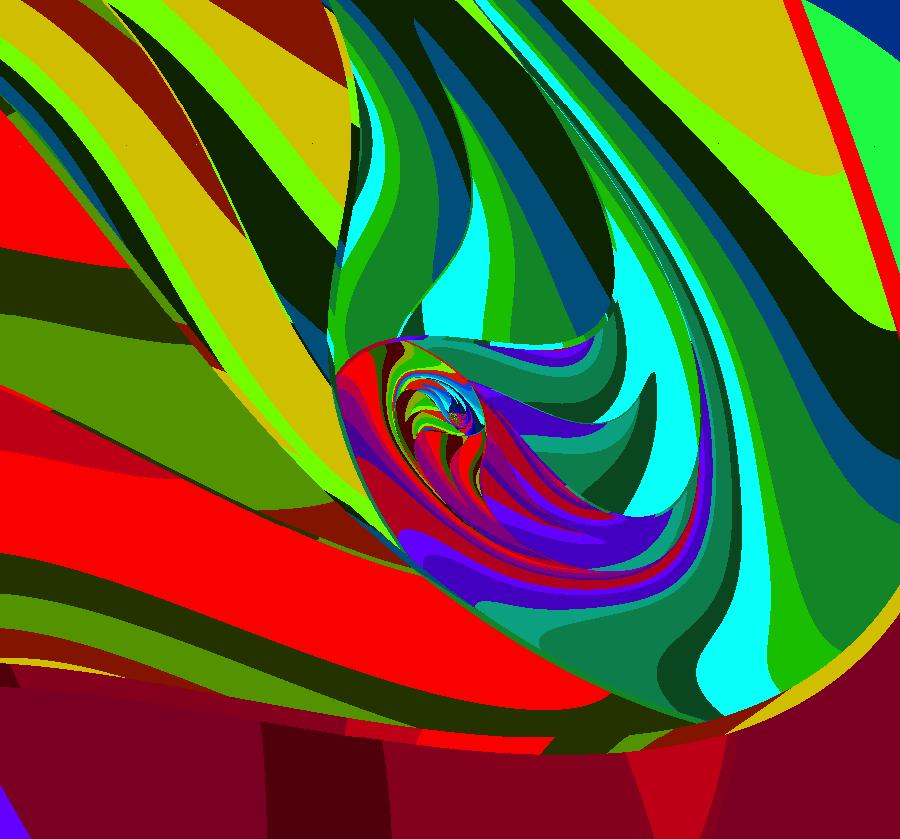
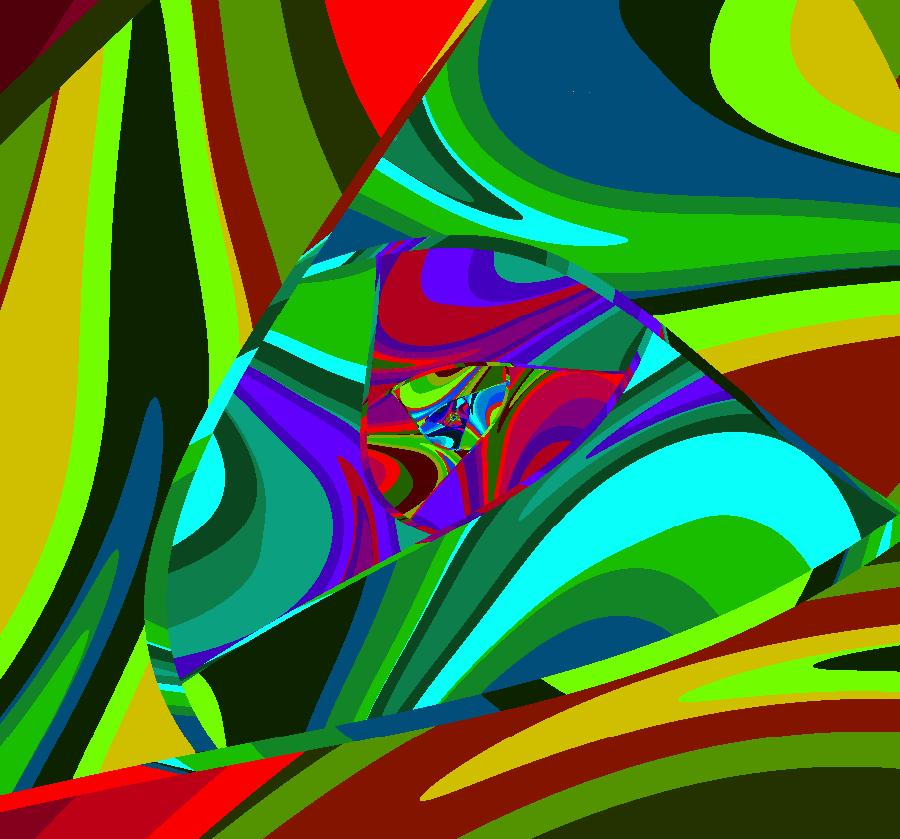
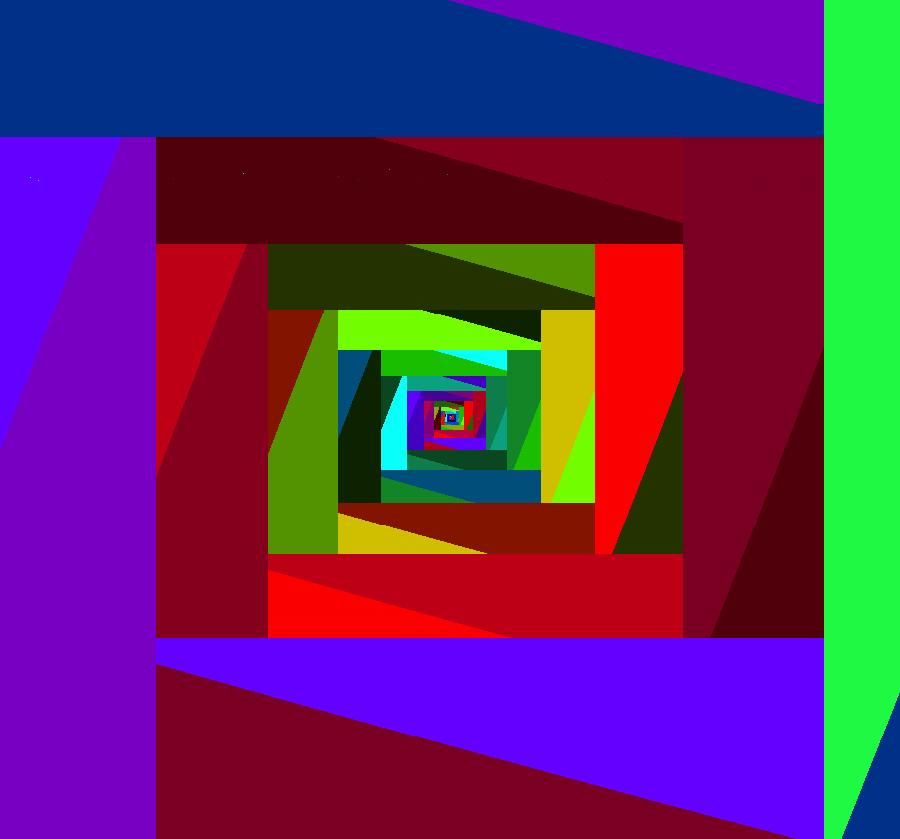
VFld: ((1+s*.1)*(y-step(x)*cos(b*x-c)),(1+s*.05)*(a-x)), a=-.06; b=.62; c=-.055; s=2.3 This iteration is defined by: x <- (1+s*.1)*(y-step(x)*cos(b*x-c)), y <- (1+s*.05)*(a-x). Parameters are: a=-.06; b=.62; c=-.055; s=2.3 EMap CT: 2 The 4 fcs are at: fc1 ~ (-.035,-.029), fc2 ~ (.41,.66), fc3 ~ (-.33,-.52), fc4 ~ (-.63,.29), Centering at fc1 gives spirals of rectangles and triangles. Centering at fc2, fc3 or fc4 gives spirals of curves. Use a small selection square at fcn to zoom in then center as needed. Image 0: locations of fc1 through fc4 Image 1: zoomed in at fc1 Image 2: zoomed in at fc2 Image 3: zoomed in at fc3 Image 4: zoomed in at fc4
|
|
|
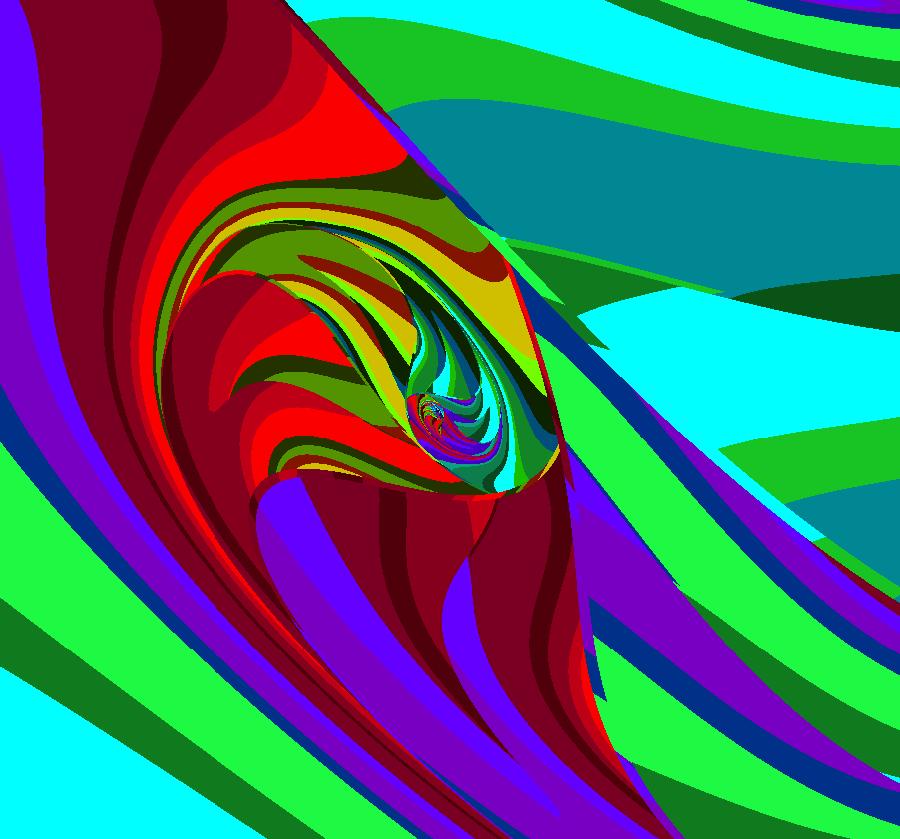
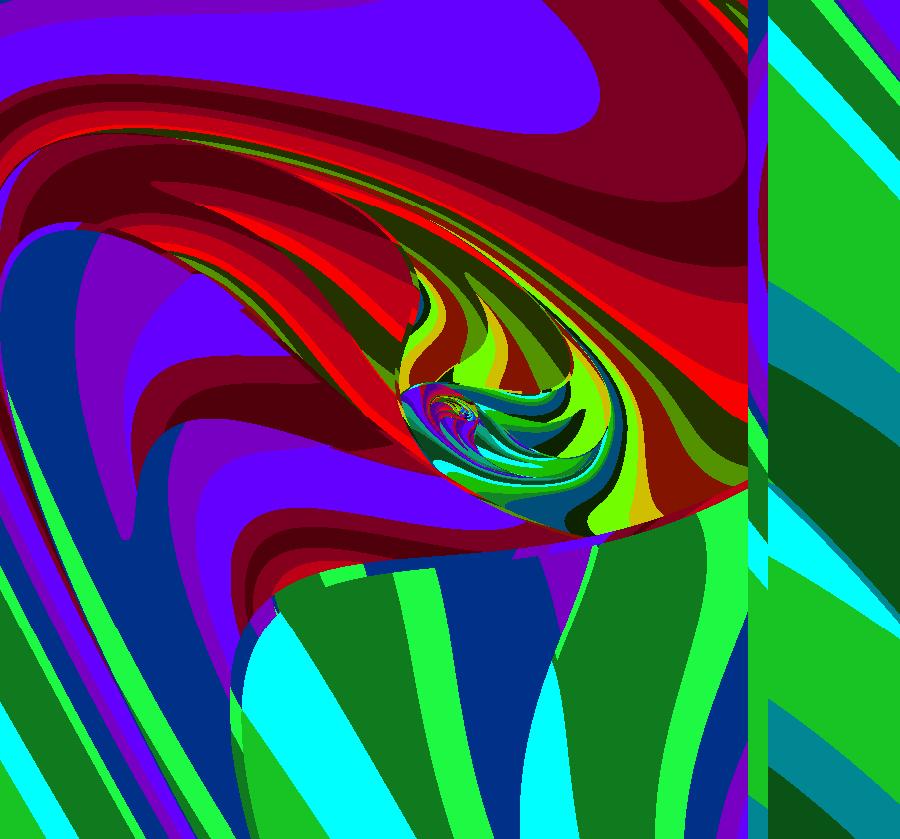
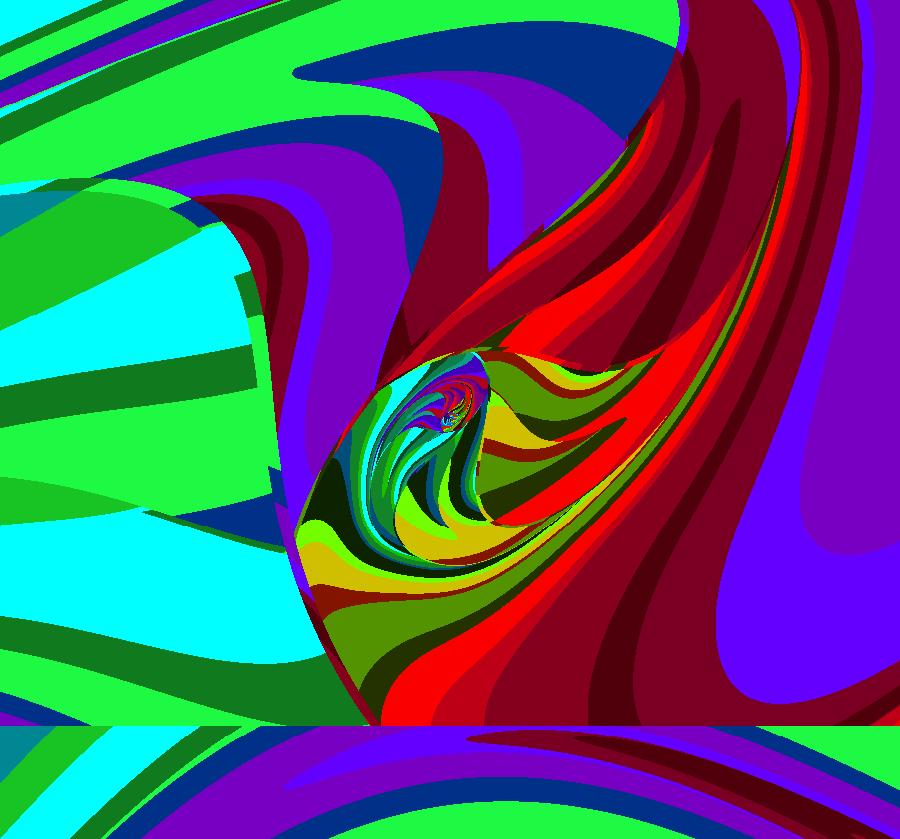
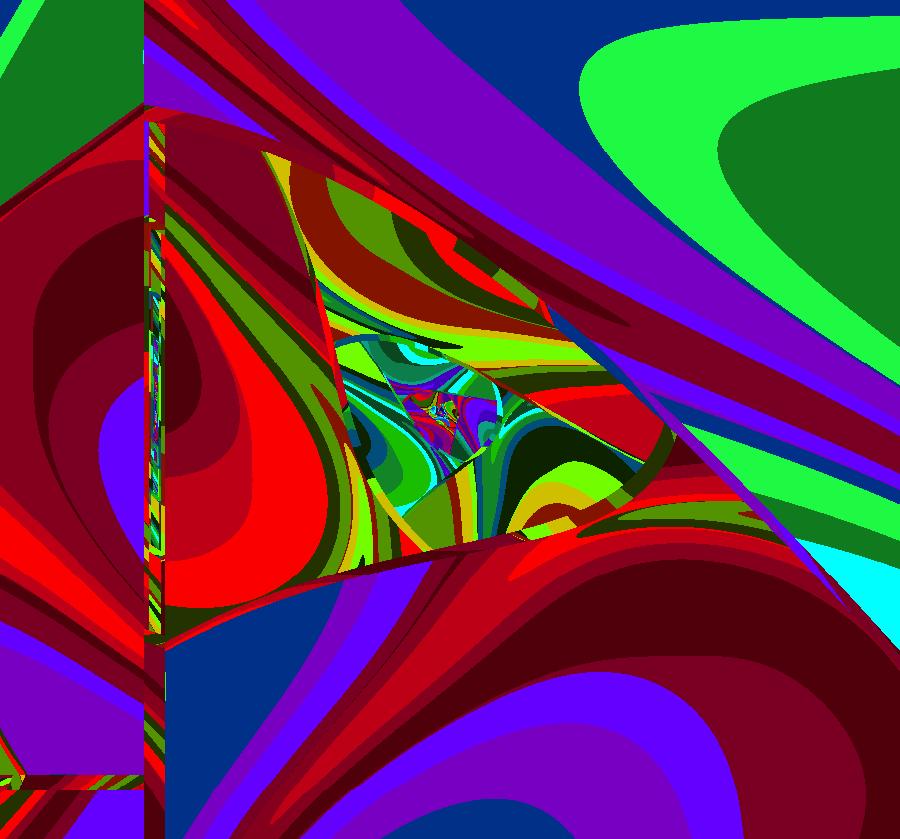
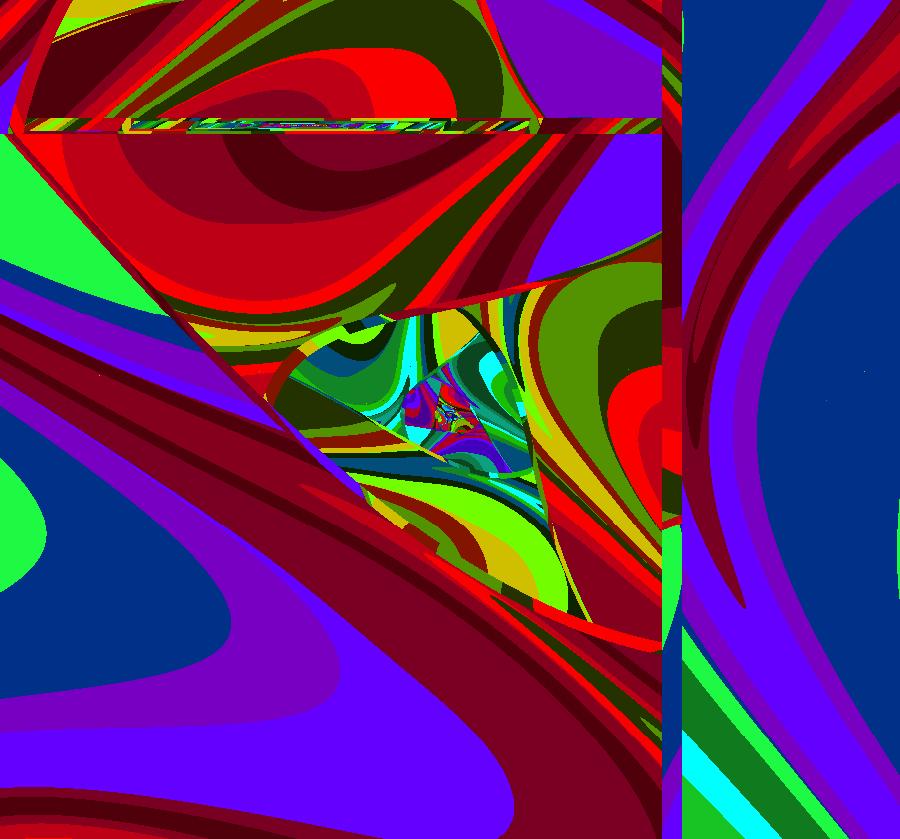
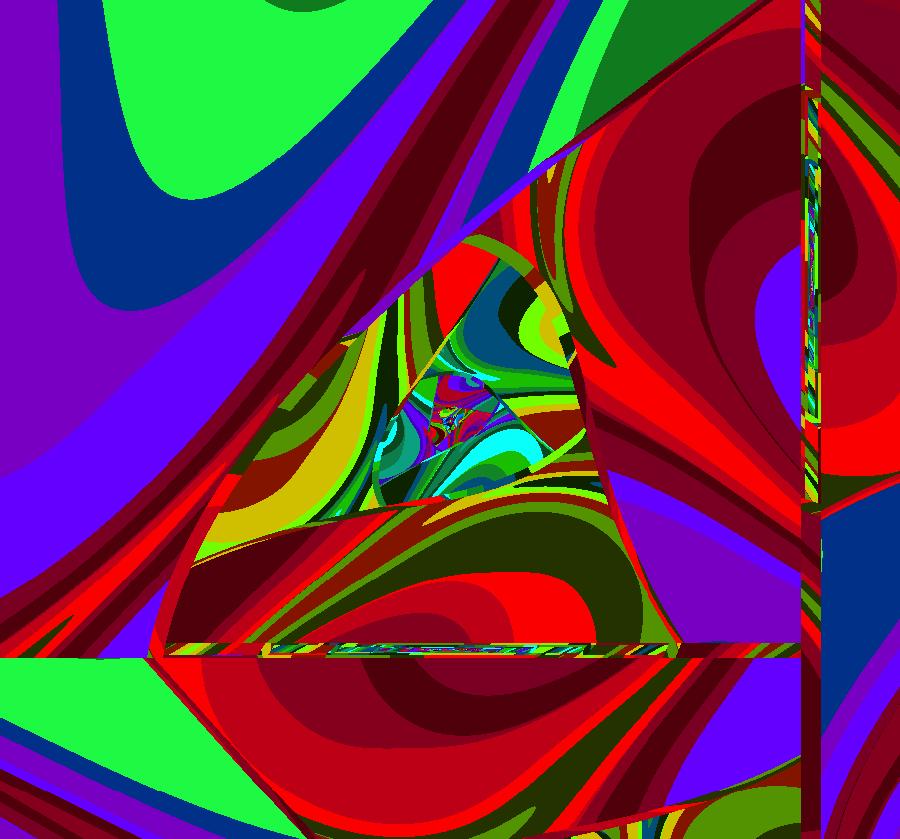
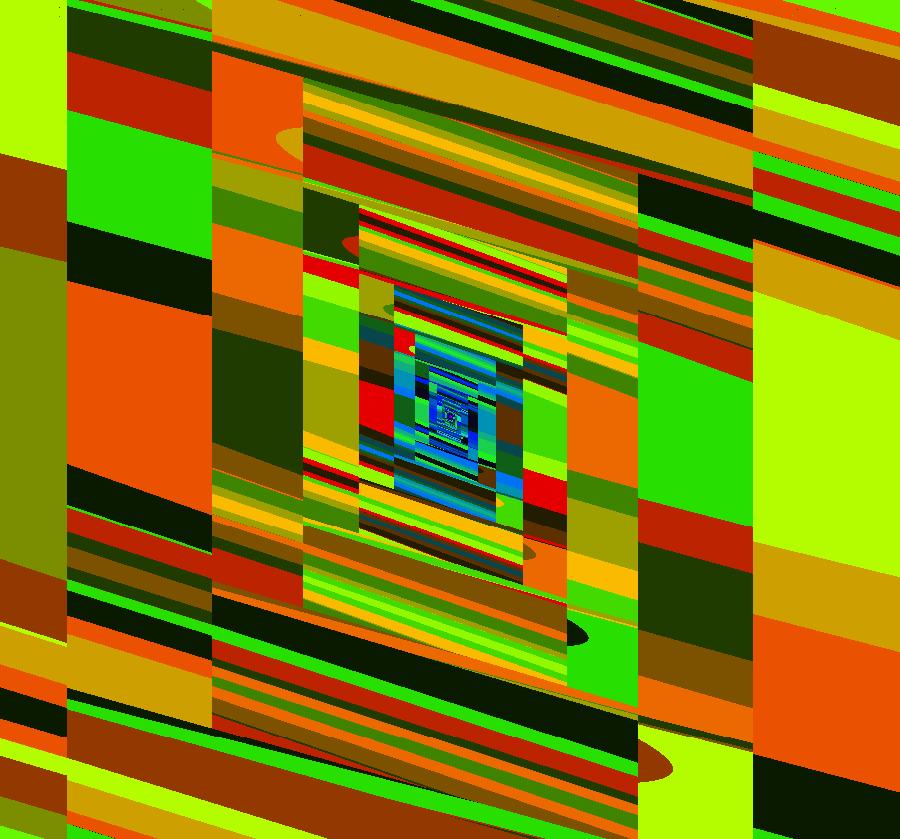
View/Sys/Gal: EMap " 8 fcs, ver 1 EMapCT2" in "FractalCenters."
Range: (vMax,vMin) = (0.005,-0.028), (hMin,hMax) = (-0.028,0.003)
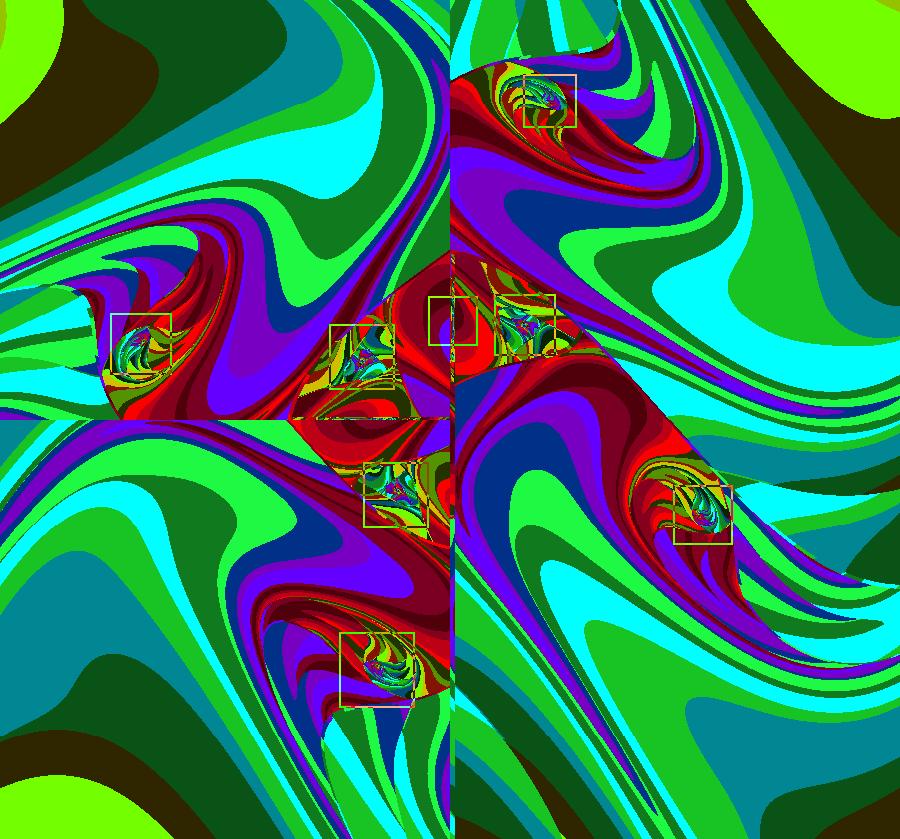
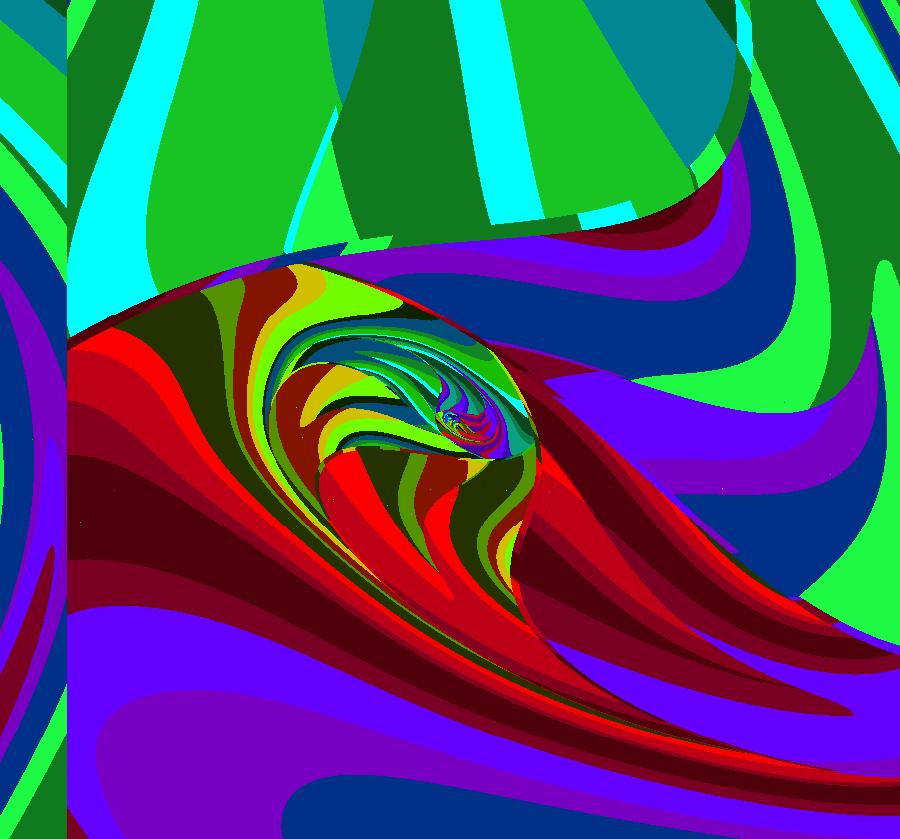
VFld: ((1+s*.1)*(y-step(x)*cos(b*x-c)),(1+s*.05)*(a-x)), a = -.0230; b = -1.2000; c = .1300; s = 1.7000; This iteration is defined by: x <- (1+s*.1)*(y-step(x)*cos(b*x-c)), y <- (1+s*.05)*(a-x). Parameters are: a = -.0230; b = -1.2000; c = .1300; s = 1.7000; EMap CT: 2 There are 8 interesting fractal centers: an outer ring of 4, an inner ring of 3 and the point near (0,0). Zoom way in to see the one near (0,0). Outer ring: fc1 ~ (.517,1.882), fc2 ~ (1.41,-.615), fc3 ~ (-.39,-1.55), fc4 ~ (-1.77,.39). Inner ring: fc5 ~ (.399,.516), fc6 ~ (-.324,-.474), fc7 ~ (-.53,.31). Center: fc8 ~ (-.012,-.012). Use a small selection square at fcn to zoom in then center as needed. Image 0: locations of fc1 through fc8 Image 1: zoomed in at fc1 Image 2: zoomed in at fc2 Image 3: zoomed in at fc3 Image 4: zoomed in at fc4 Image 5: zoomed in at fc5 Image 6: zoomed in at fc6 Image 7: zoomed in at fc7 Image 8: zoomed in at fc8
|
|
|
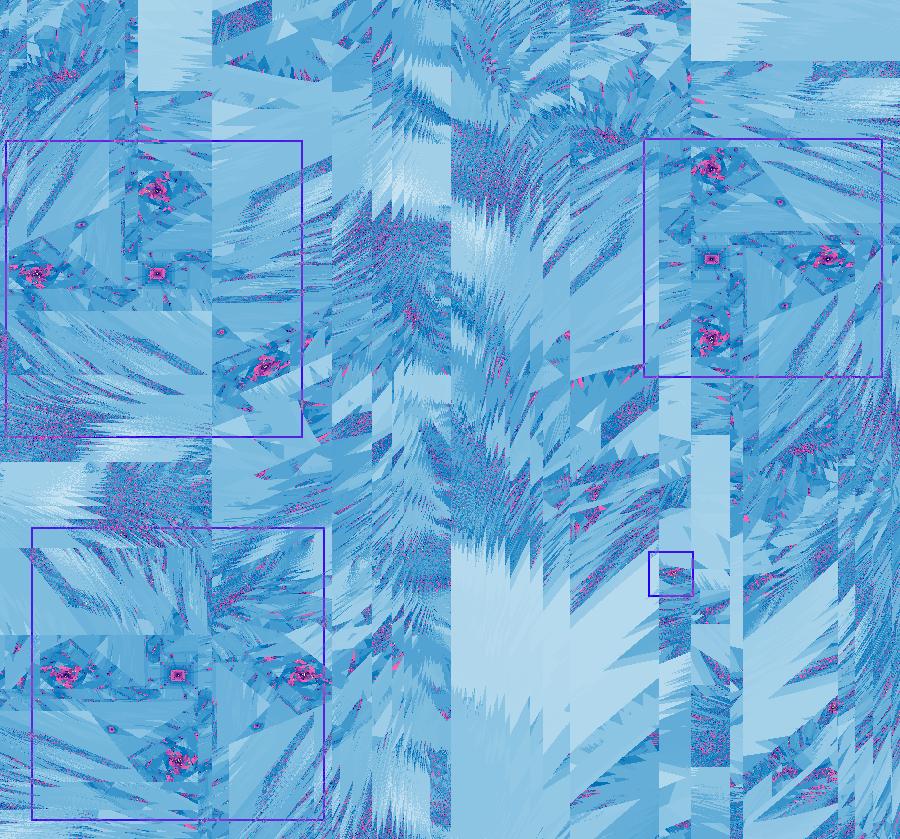
View/Sys/Gal: EMap " 8 fcs, ver 2 EMapCT2" in "FractalCenters."
Range: (vMax,vMin) = (0.567,0.566), (hMin,hMax) = (0.016,0.016)
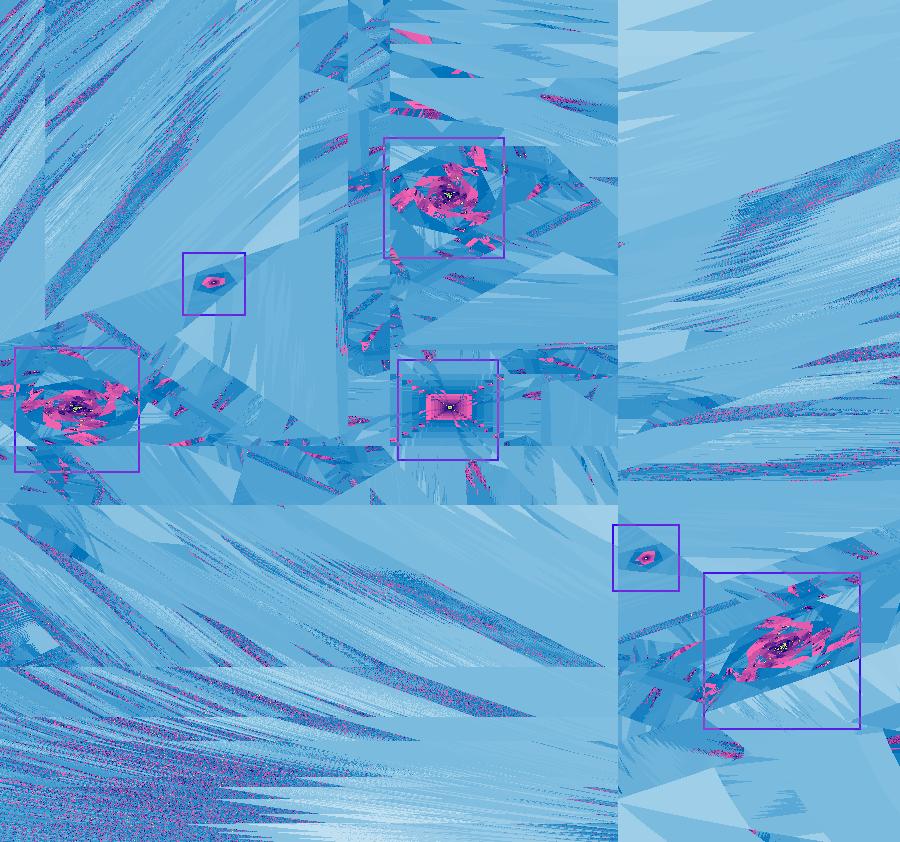
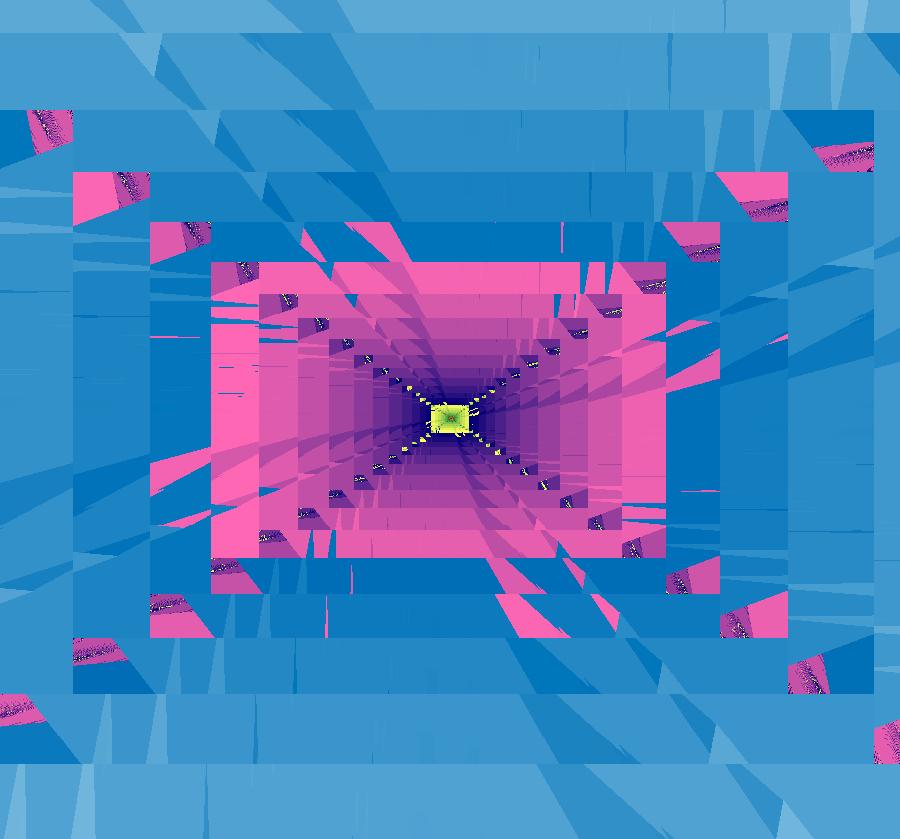
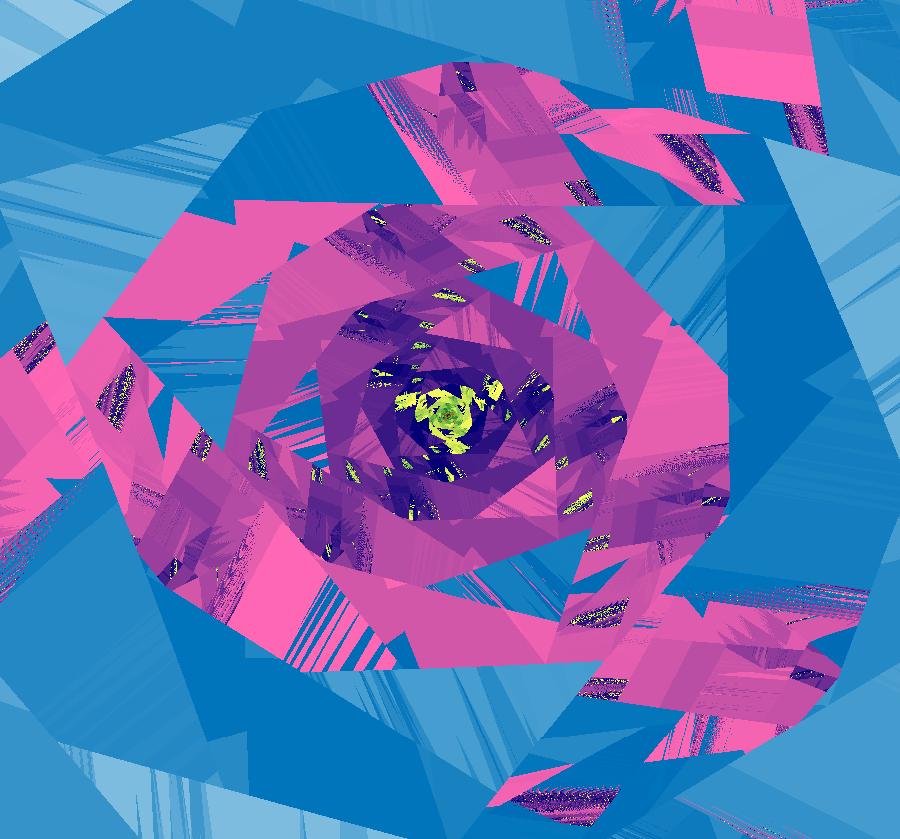
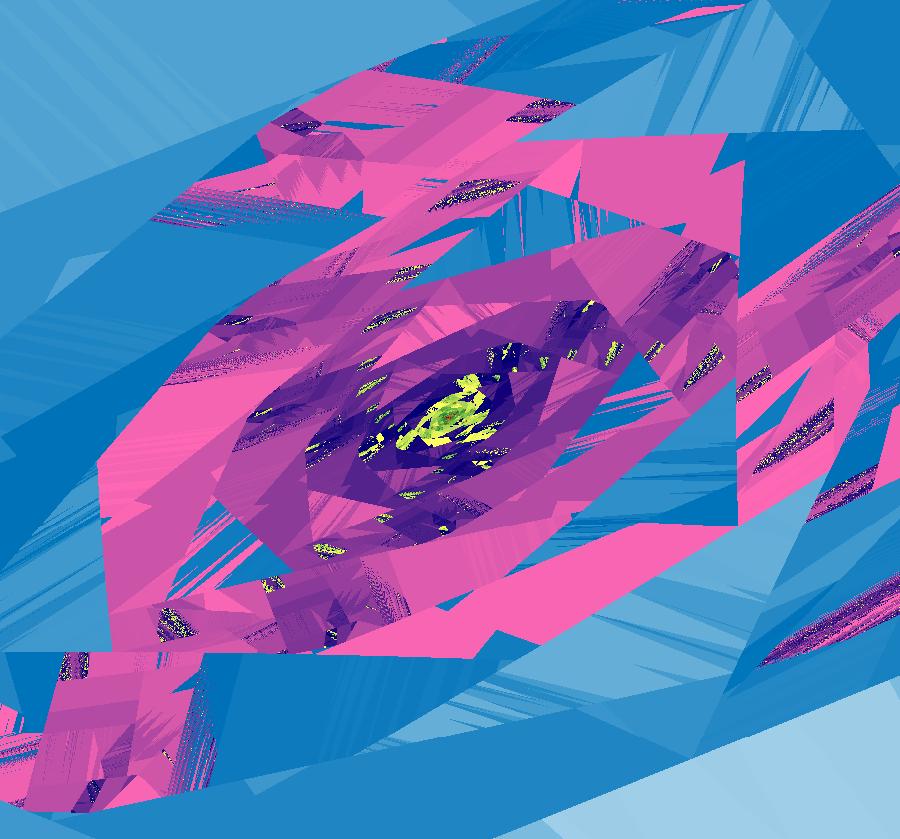
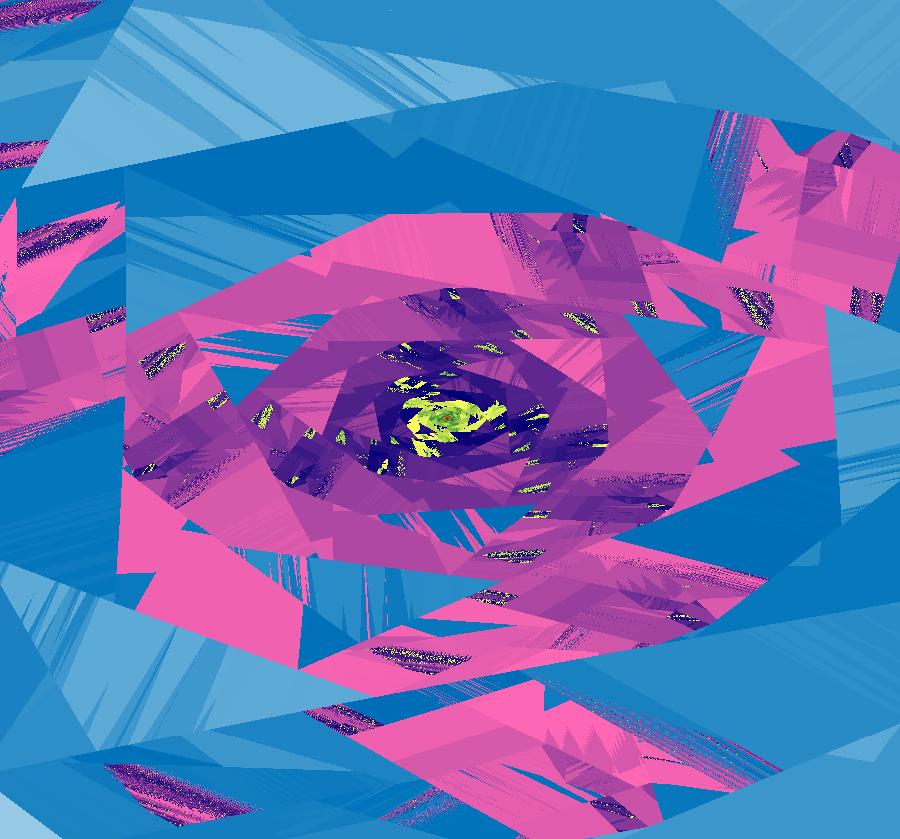
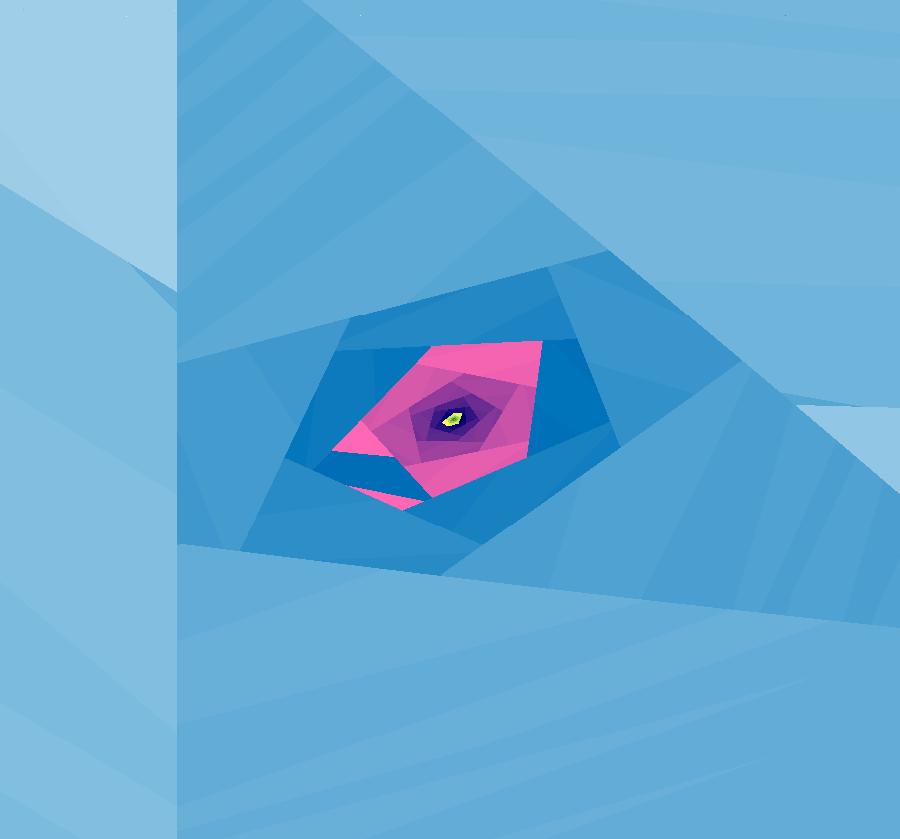
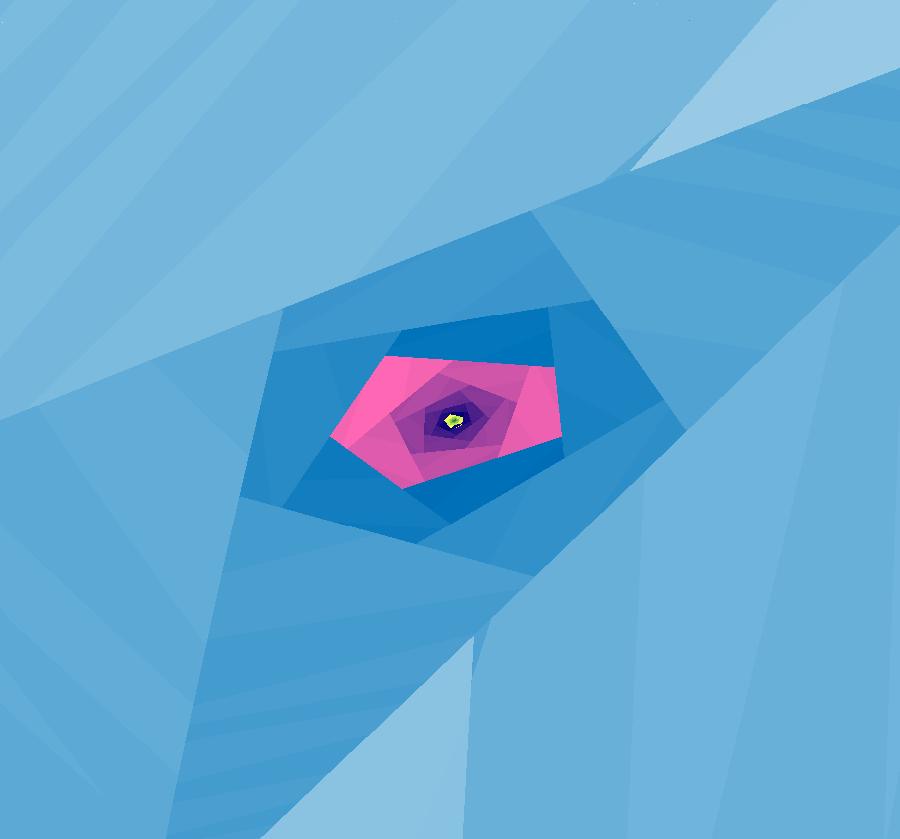
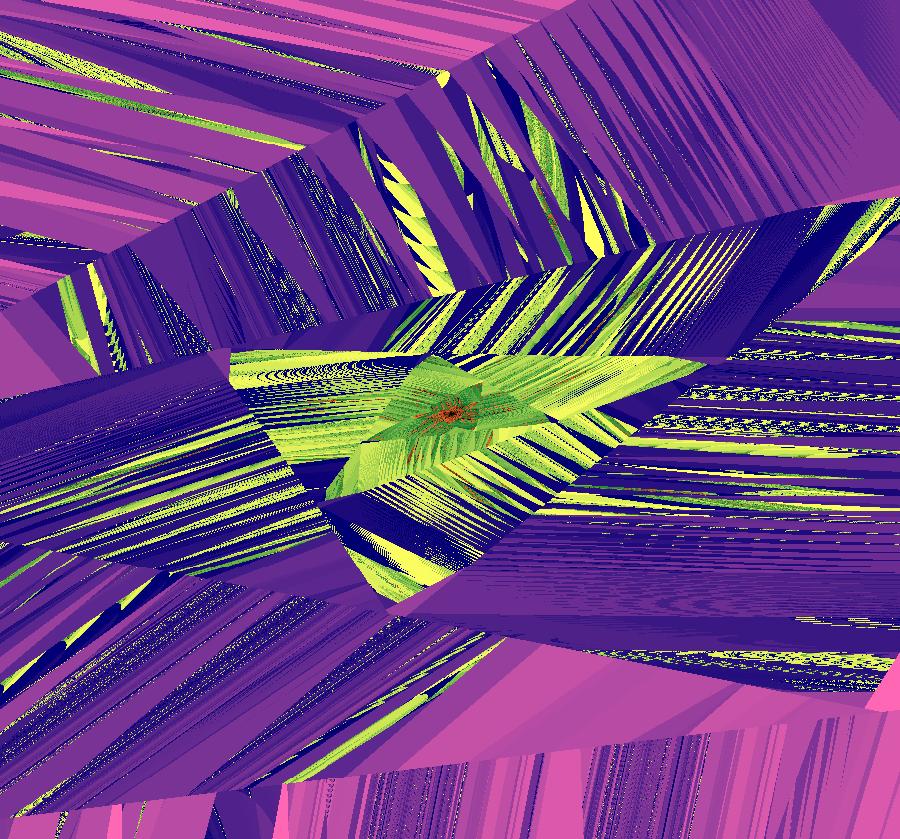
VFld: ((1+s*.1)*(y-step(x)*cos(b*x-c)),(1+s*.05)*(a-x)), a = .0280; b = -1.2000; c = .1300; s = 1.7000; This iteration is defined by: x <- (1+s*.1)*(y-step(x)*cos(b*x-c)), y <- (1+s*.05)*(a-x). Parameters are: a = .0280; b = -1.2000; c = .1300; s = 1.7000; EMapMax CT: 2 Outer ring: fc1 ~ (.538,1.87), fc2 ~ (1.4,-.563), fc3 ~ (-.414,-1.48), fc4 ~ (-1.7,.46). Inner ring: fc5 ~ (.423,.547), fc6 ~ (-.281,-.438), fc7 ~ (-0.4868086,0.3516923). Near the y axis: fc8 ~ (.0155728,.5669652) with vMax = .5842367, vMin = .5482794, hMin = .0147731, hMax = .0165532. For fc8 try EMapMaxCT5 and zoom way in. Image 0: locations of fc1 through fc8 Image 1: zoomed in at fc1 Image 2: zoomed in at fc2 Image 3: zoomed in at fc3 Image 4: zoomed in at fc4 Image 5: zoomed in at fc5 Image 6: zoomed in at fc6 Image 7: zoomed in at fc7 Image 8: zoomed in at fc8
|
|
|
View/Sys/Gal: EMap "18 fcs, EMapMaxCT3" in "FractalCenters."
Range: (vMax,vMin) = (-0.914,-0.923), (hMin,hMax) = (0.478,0.484)
VFld: ((1+.1*s)*(y-sgn(x)*sqrt(abs(b%x-c))),(1+.1*s)*(a-x%d)), a = -.630; b = .520; c = .870; d = 71.000; s = .190; This system is "NonSmoothExs: ( 6d) painting by the numbers, EMapMaxCT1" which was first discussed in gallery "PlottingCurves." The system is defined by: x <- (1+.1*s)*(y-sgn(x)*sqrt(abs(b%x-c))), y <- (1+.1*s)*(a-x%d). Parameters are: a = -.630; b = .520; c = .870; d = 71.000; s = .190; The system has 18 fcs arranged in 3 main clusters of 6 fcs each. Each cluster has a central fc, three larger outer satellite fcs and two smaller satellite clusters. The fractal clusters are best seen on a large retina display in the EMapMaxCT3 view. Image 1: zoomed out view showing the three main fc clusters and a possible singlet fc. Image 2: zoomed in view showing the upper left cluster centered at: fc1 ~ (-0.6388030,-0.0399870). Image 3: zoomed in at fc1. For fc1 the three large satellite fractal centers are at: fc2 ~ (-.638,.212), fc3 ~ (-.402,-.319), fc4 ~ (-.898,-.0413), and the two small satellite fractal centers are at: fc5 ~ (-.498,-.214), fc6 ~ (-.803,.109). Image 4: zoomed in at fc2. Image 5: zoomed in at fc3. Image 6: zoomed in at fc4. Image 7: zoomed in at fc5. Image 8: zoomed in at fc6. The other two main clusters, with 6 more fcs each, give fractal images similar to the first cluster. There is a possible singlet fractal center at: fc? ~ (.4811957,-.9182301). Image 9: zoomed in at fc?.
|
|
|
View/Sys/Gal: EMap "98 fcs, EMapMaxCT1" in "FractalCenters."
Range: (vMax,vMin) = (1.117,-1.117), (hMin,hMax) = (-0.916,0.916)
VFld: (1.007*(y-sgn(x)),-1.007*x)
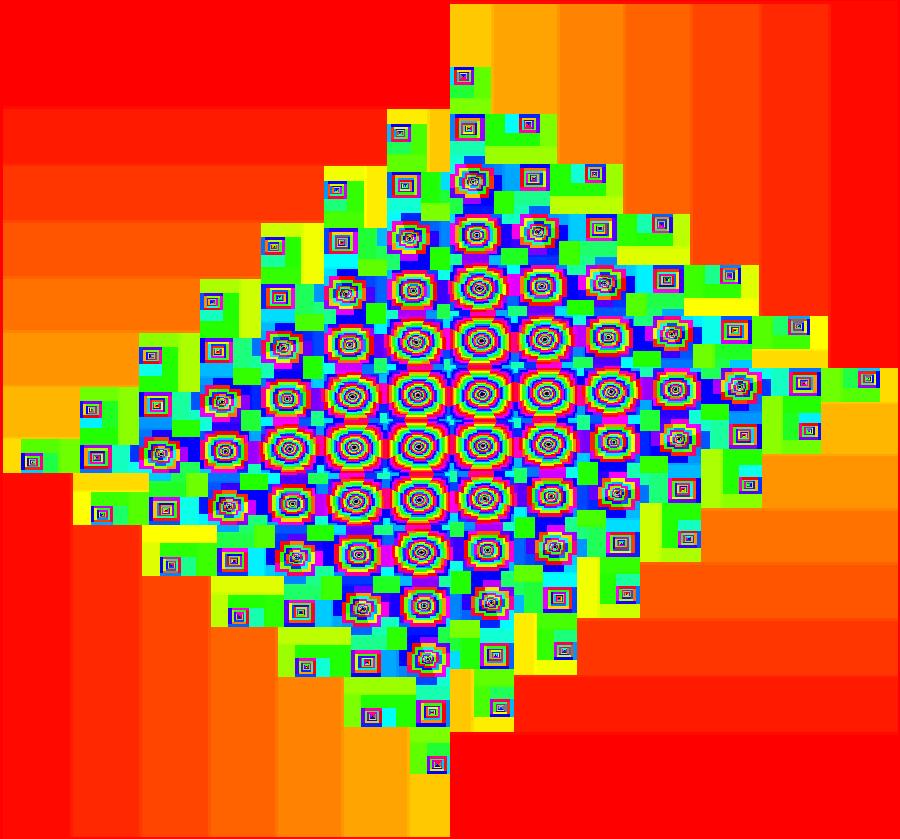
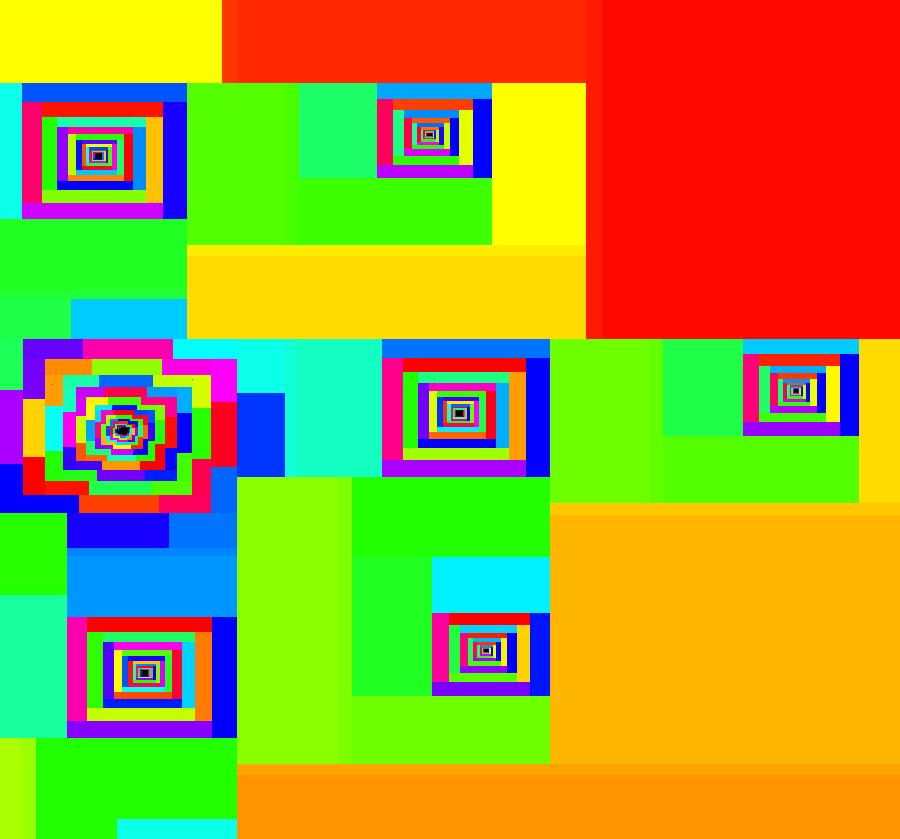
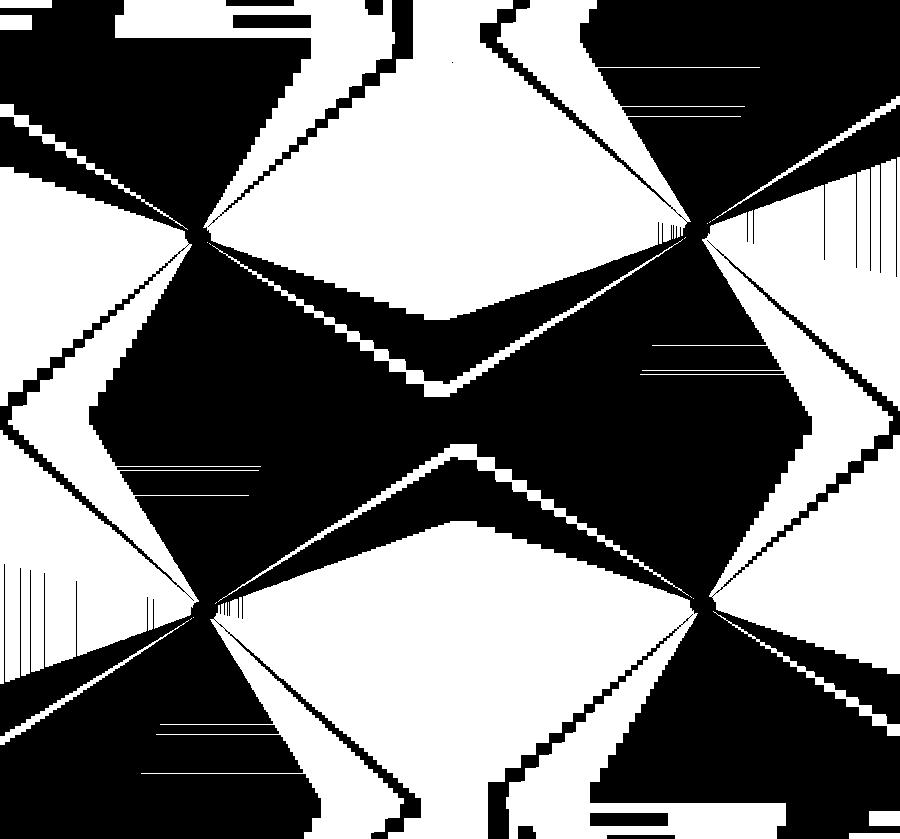
This is a simplified version of the previous 50 fcs example. It is an "almost" linear, system which has 98 fractal centers. The iteration is defined by: x <- 1.007*(y-sgn(x)), y <- -1.007*x. EMapMax CT: 1 Use the square prison view. There are 7 rings of fractal centers and the fcs in a ring are the same under a rotation of the ring of π about (0,0). Image 1: The 26+22+18+14+10+6+2 = 98 fcs. Image 2: Zoomed in on the 7 fcs on the right edge of image 1. Image 3: Zoomed in on the 4 fcs centered at (0,0) with CT 9.
|
|
|
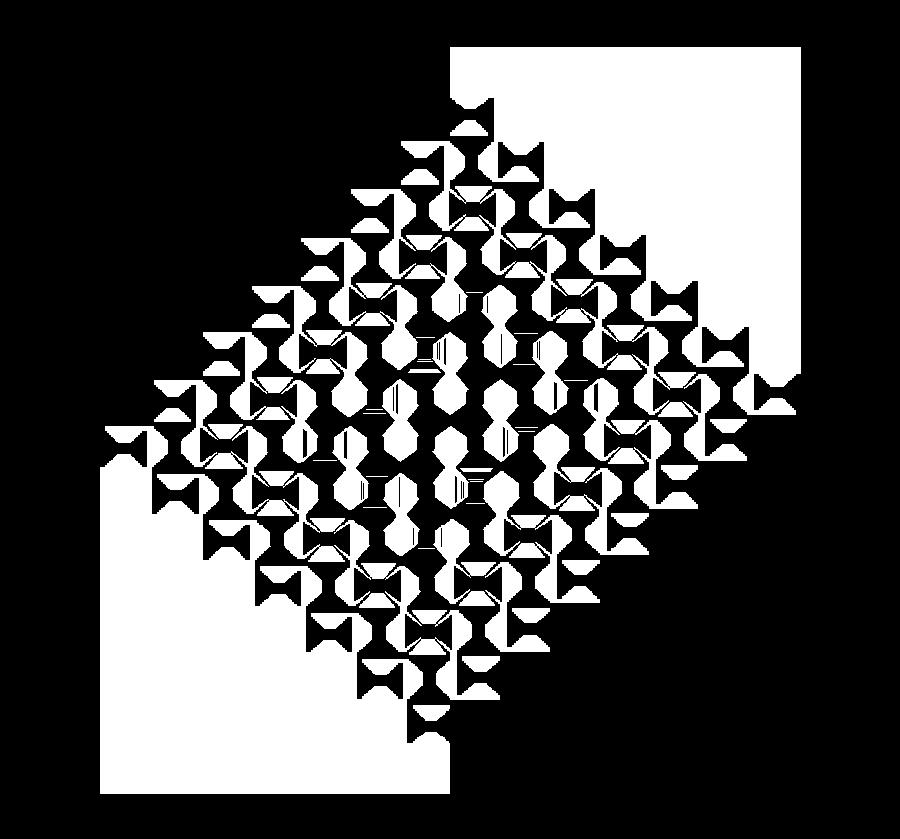
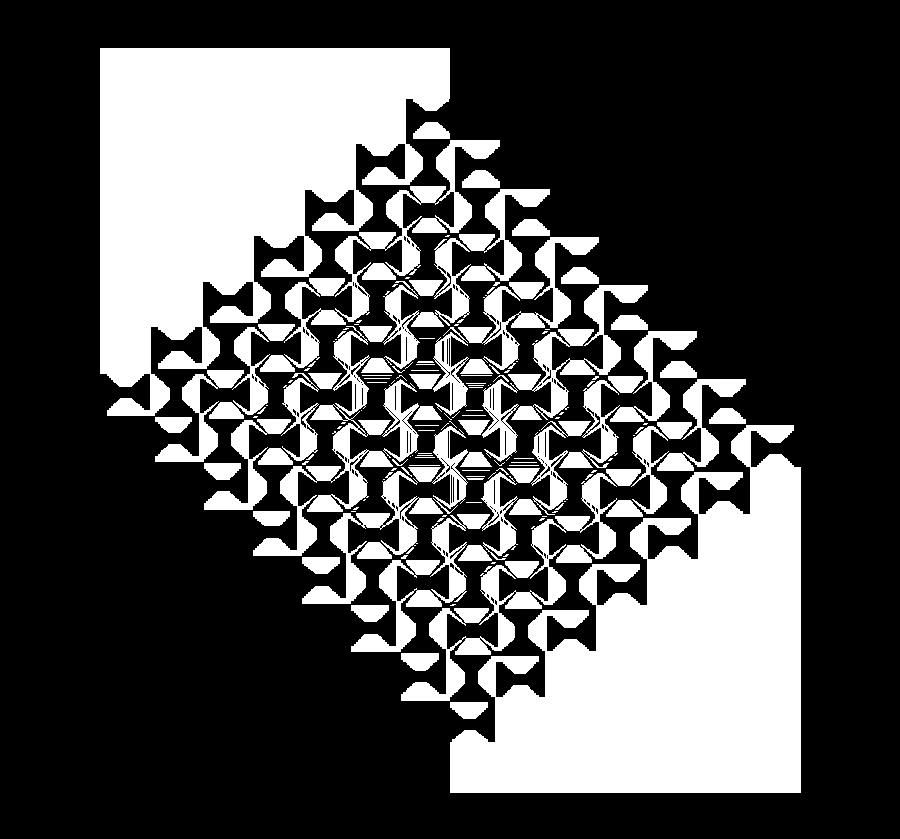
View/Sys/Gal: EMap "98 fcs, EMapMaxCT9 Escher" in "FractalCenters."
Range: (vMax,vMin) = (9.000,-9.000), (hMin,hMax) = (-9.000,9.000)
VFld: (-1.005*(y-sgn(x)),x) This iteration is defined by: x <- -1.005*(y-sgn(x)), y <- x. EMapMax CT: 9 Image 1: Full image with a square prison.
|
|
|
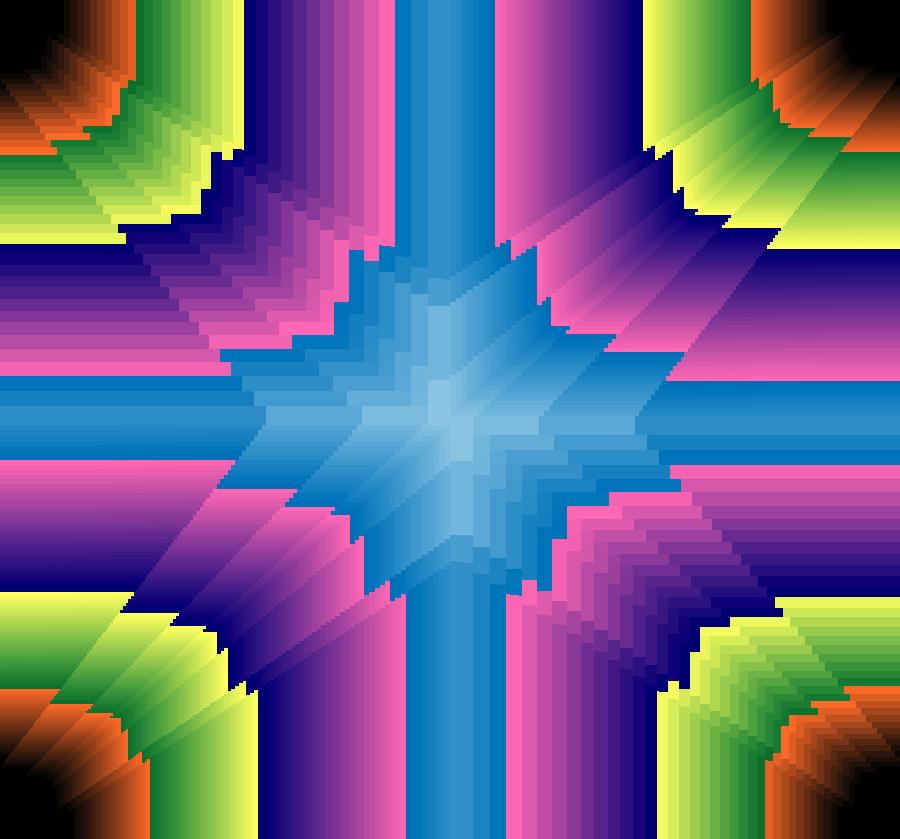
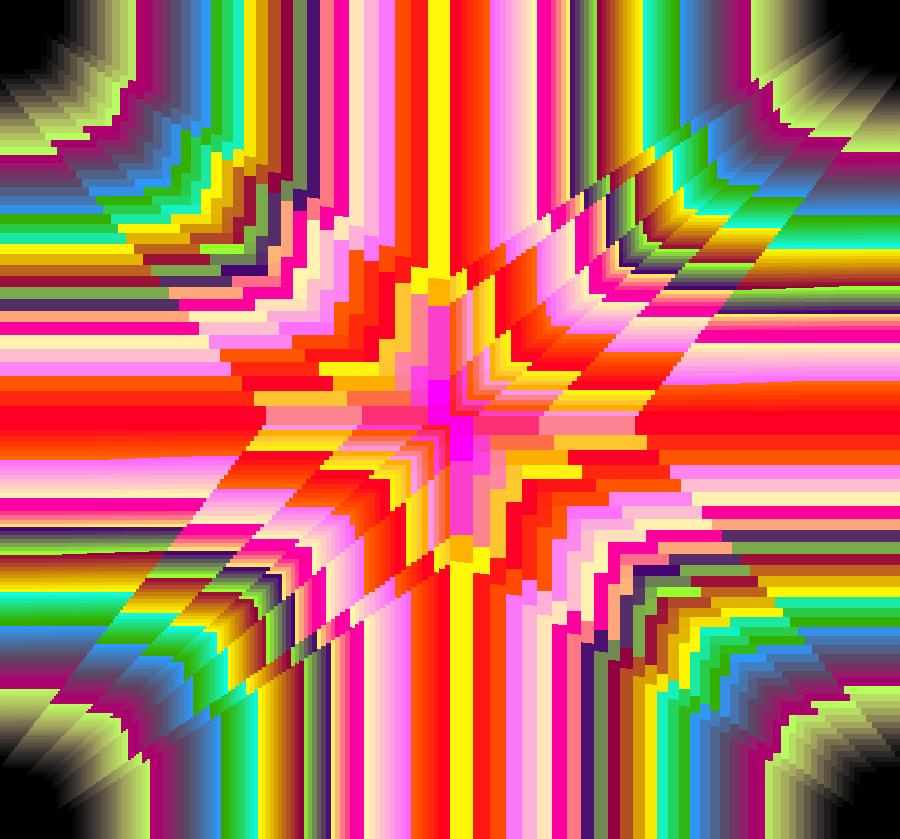
View/Sys/Gal: EMap "98 fcs, EMapMaxCT9 Escher 2" in "FractalCenters."
Range: (vMax,vMin) = (9.000,-9.000), (hMin,hMax) = (-9.000,9.000)
VFld: (-1.005*y-sgn(x),x) This iteration is defined by: x <- -1.005*y-sgn(x), y <- x. EMapMax CT: 9 Image 1: Full image with a square prison.
|
|


|
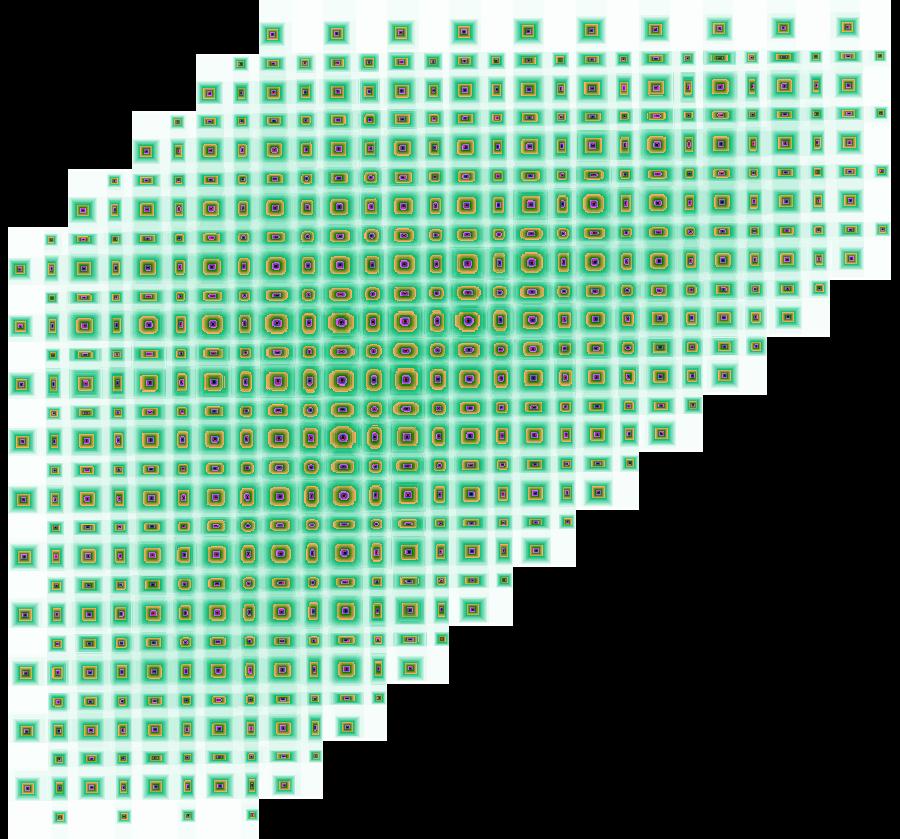
View/Sys/Gal: EMap "98 fcs, EMapMaxCT9 Escher 3" in "FractalCenters."
Range: (vMax,vMin) = (0.402,-0.402), (hMin,hMax) = (-0.384,0.384)
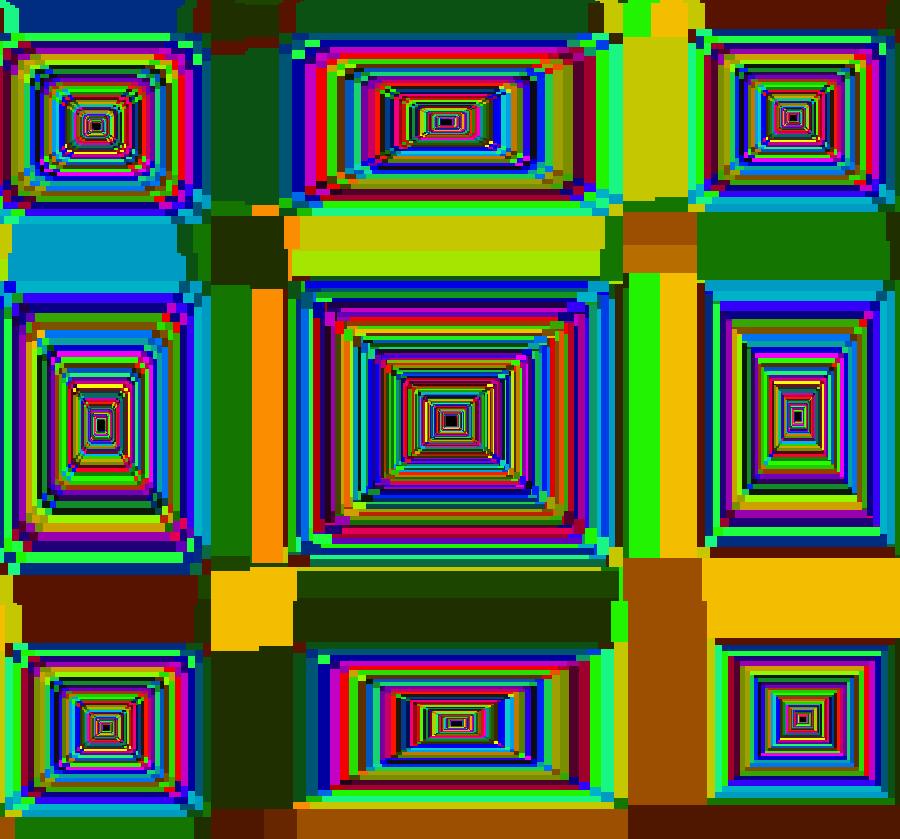
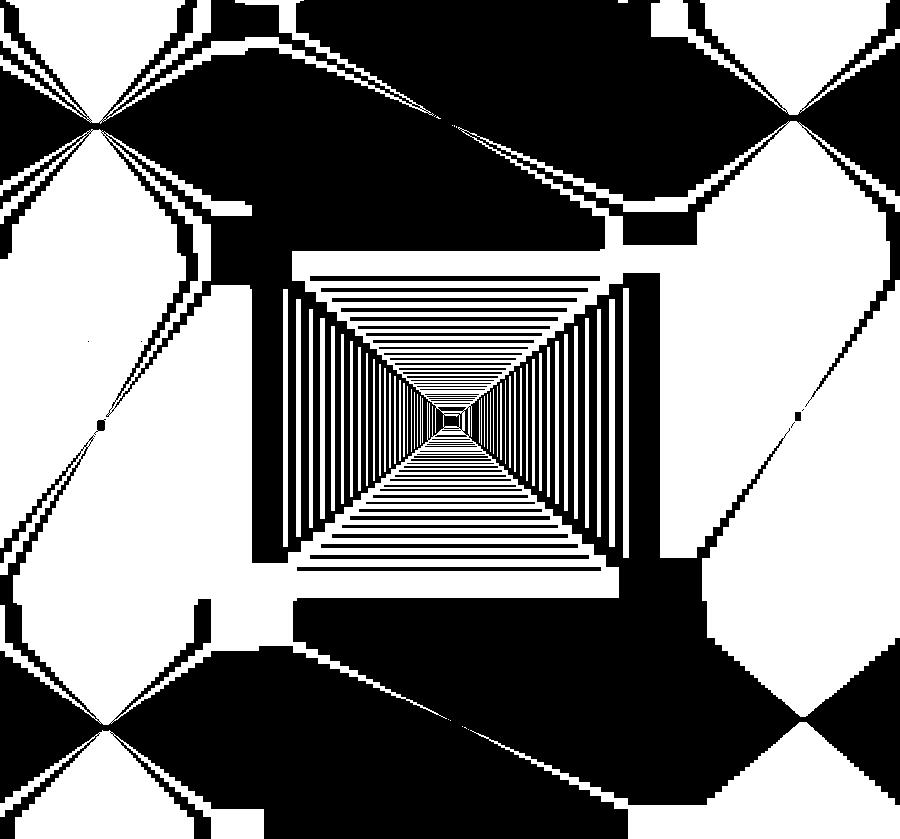
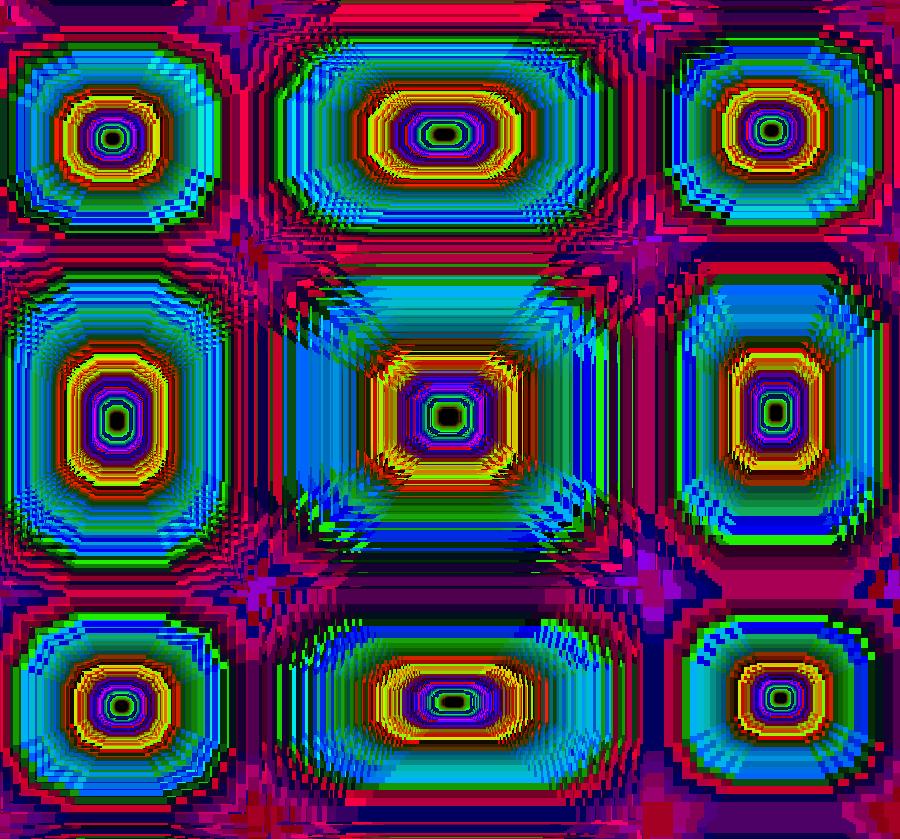
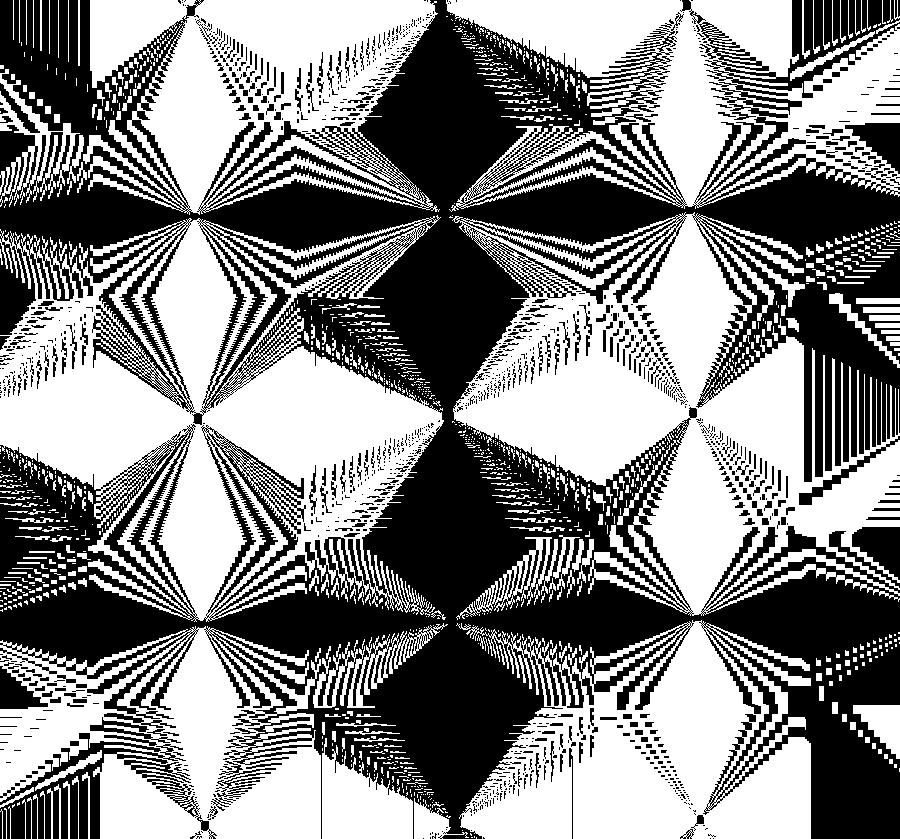
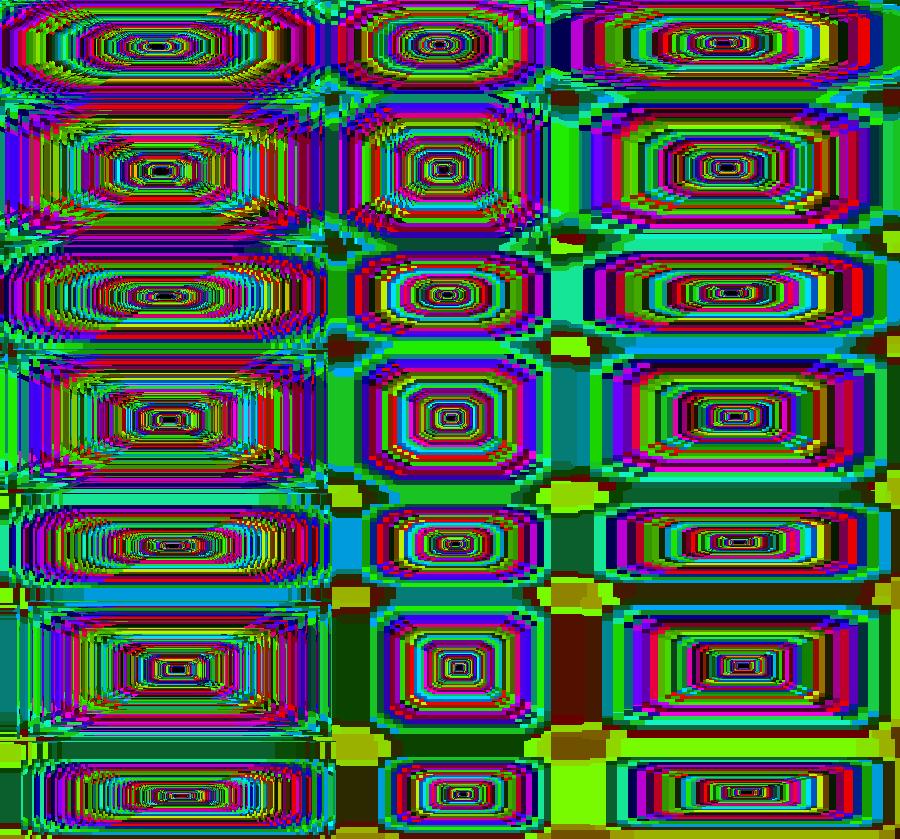
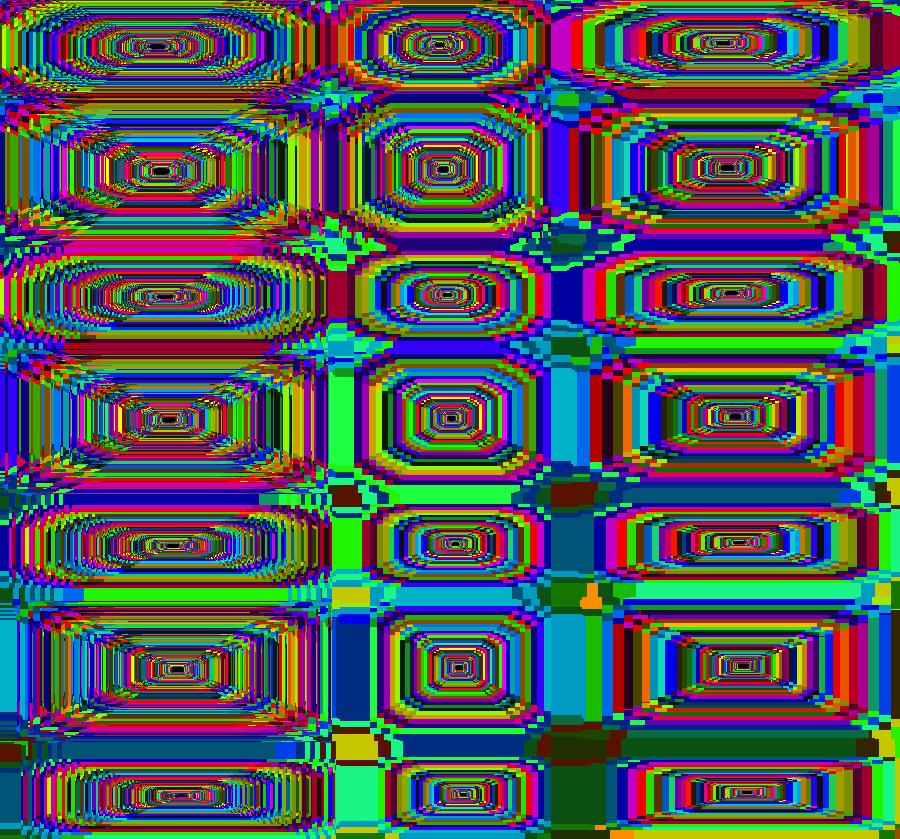
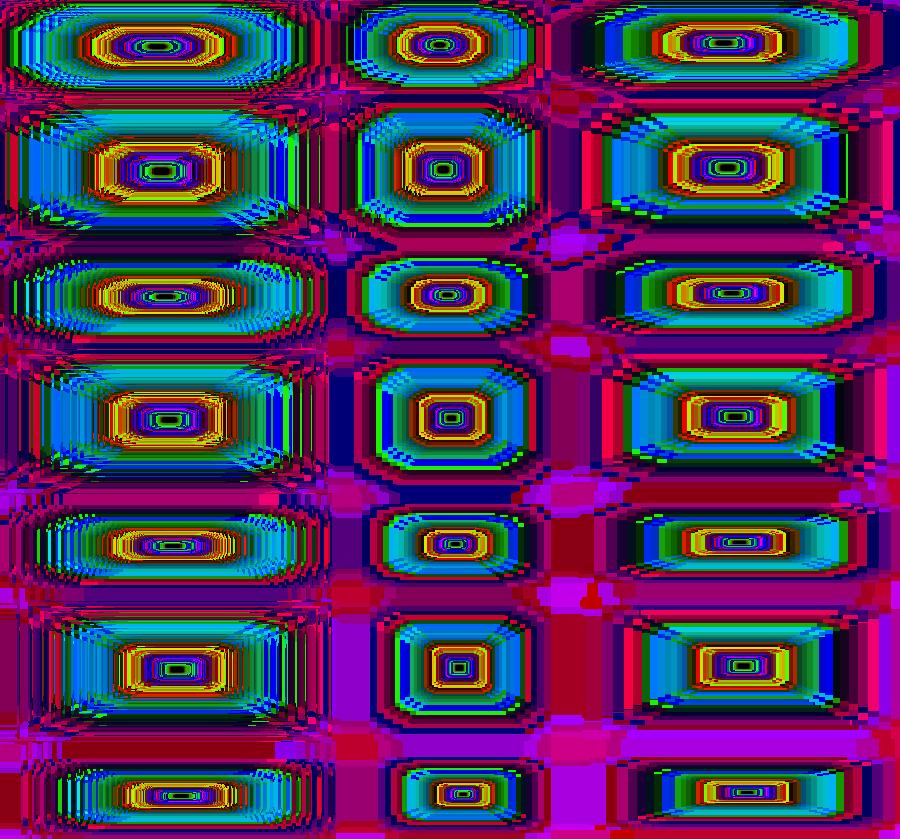
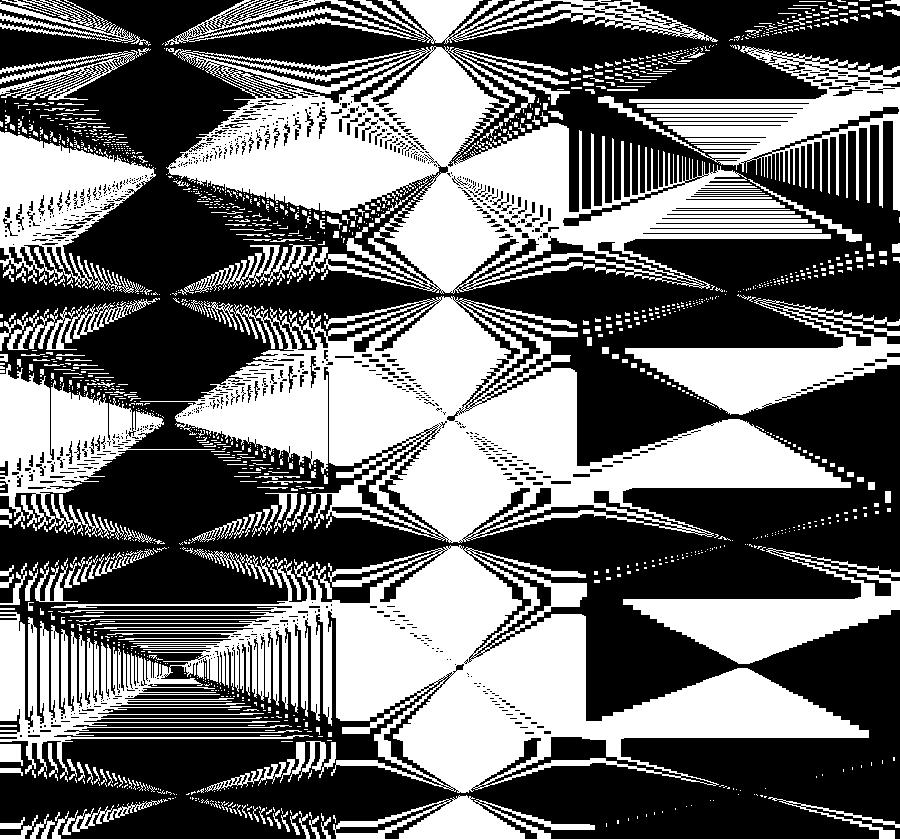
VFld: (-1.005*y+sgn(x),x) This iteration is defined by: x <- -1.005*y+sgn(x), y <- x. EMapMax CT: 9 Image 1: Zoomed image with a square prison and CT 9. Image 2: Zoomed image with a round prison and CT 9. Image 3: Zoomed image with a round prison and CT 3. Image 4: Zoomed image with a round prison and CT 8.
|
|
|
View/Sys/Gal: EMap "512 fcs, EMapMaxCT7" in "FractalCenters080817."
Range: (vMax,vMin) = (1.400,-1.980), (hMin,hMax) = (-0.980,0.620)
VFld: (1.007*(y-ceil(x)+a),-1.007*x), a = -2.4000; This system has almost too many fcs to count. The iteration is defined by: x <- 1.007*(y-ceil(x)+a), y <- -1.007*x. Parameters are: a = -2.4000; EMapMax CT: 7 Using a square prison, the number of fcs is: 10+2*(21+23+25+27+25+23+21+19+17+15+13+11+9)+4 = 512. Note: using the default circular prison makes it more difficult to count the fcs and it may even give a different result. Image 1: The 512 fcs, CT 7. Center at (1.346,-1.259) and zoom in. Image 2: Using CT 5. Image 3: Using CT 9. Center at (-0.7,0.7) and zoom in as needed. Image 4: Using CT 6, 9 fcs. Image 5: Using CT 9, two cat faces. With: vMax = 1.4, vMin = -1.98 and hMin = -.98, hMax = .62. Image 6: Using CT2. Image 7: Using CT5. Image 8: Using CT6. Image 9: Using CT9.
|


