|
|
View/Sys/Gal: Ode "c = -.47+.57*i, IMap1100" in "EMapExs."
Range: (vMax,vMin) = (1.600,-1.600), (hMin,hMax) = (-1.600,1.600)
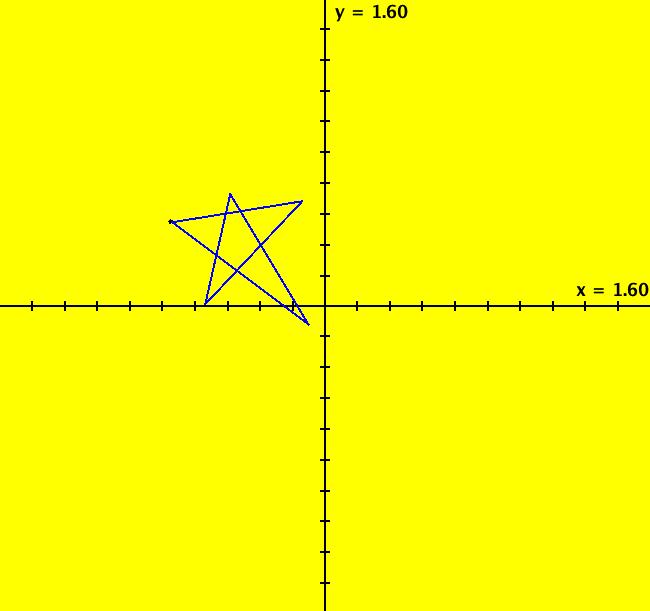
VFld: (x^2-y^2+p,2*x*y+q), p = -.47; q = .57; This iteration is defined by: x <- x^2-y^2+p, y <- 2*x*y+q. Parameters are: p = -.47; q = .57; For 2D systems, the IMap/EMap/Ode button toggles between the Ode, IMap and EMap views. The name on the button tells you what the next view is. The default view, used whenever you create a new system or open an existing system, is the Ode view. You can force the system to open in the IMap or EMap view by including "IMap" or "EMap" in the name of the system. The "IMap1100" forces the system to open in the IMap view with Settings flags:
Settings Flag | on/off state |
Show 2D IMap Orbit Sequence | on = 1 |
Show Approximate Orbit Period | on = 1 |
Hide Axes | off = 0 |
Hide Arrowheads/Seeds | off = 0 |
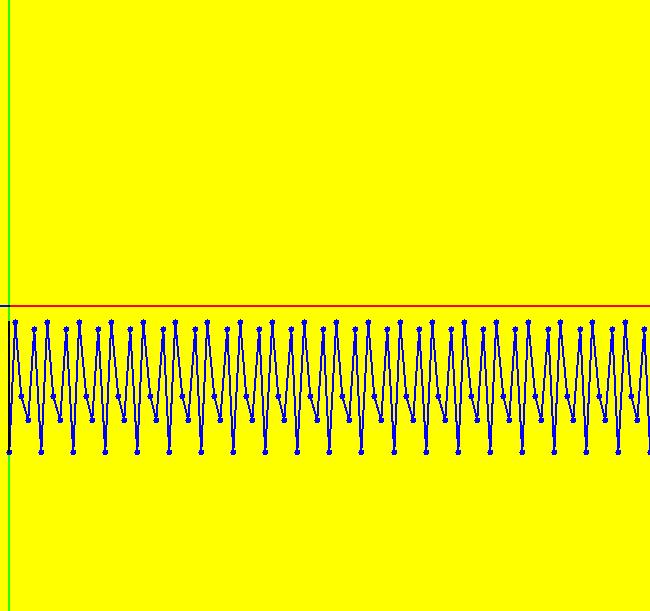
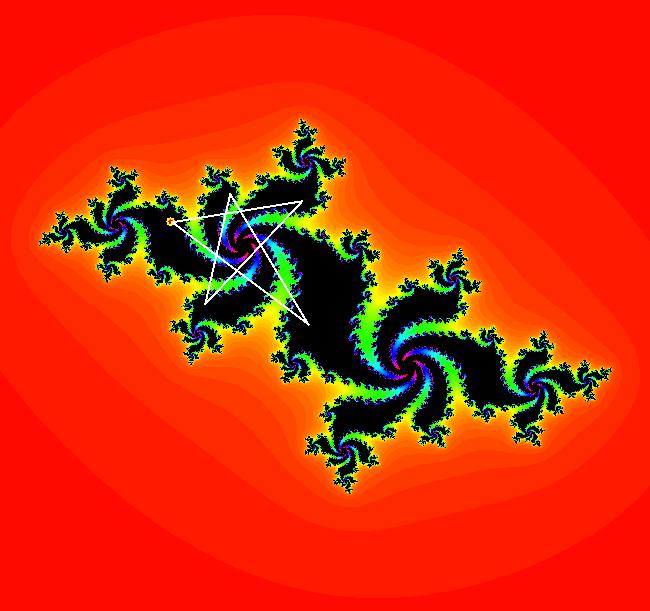
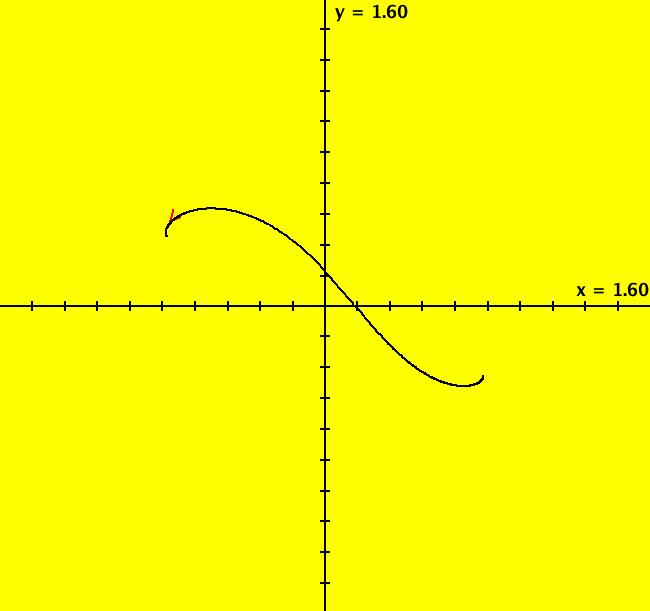
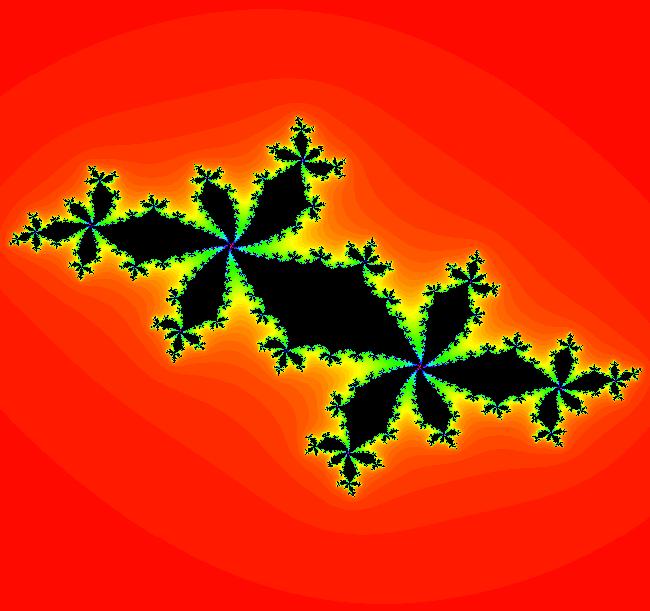
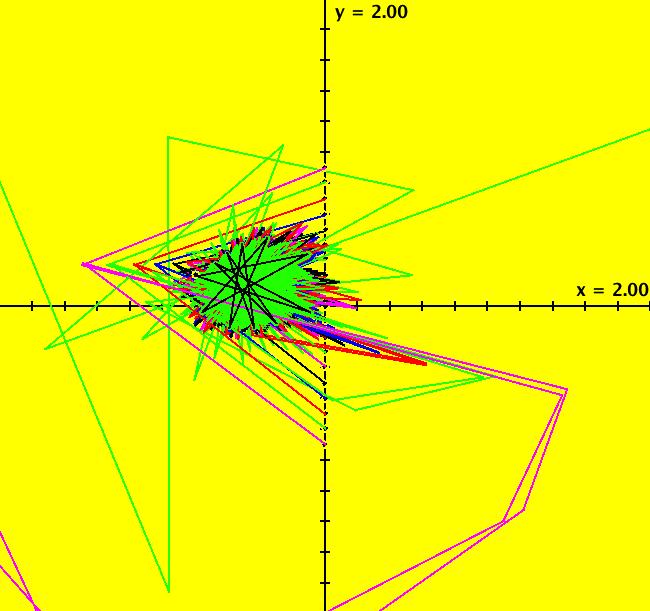
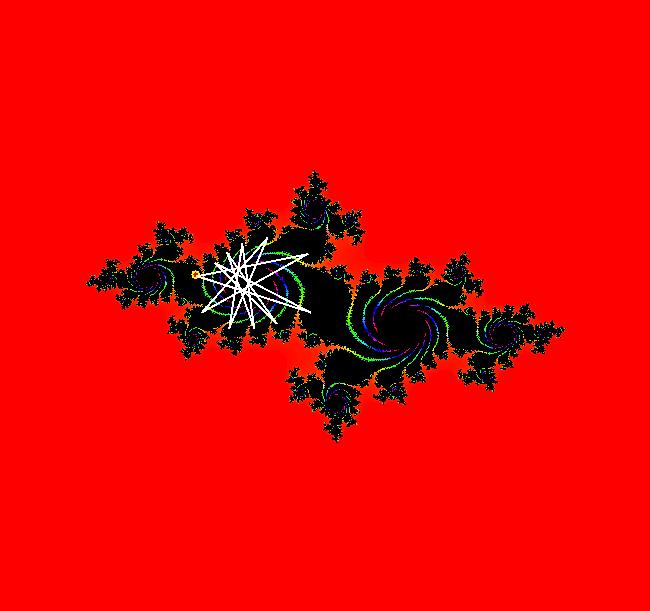
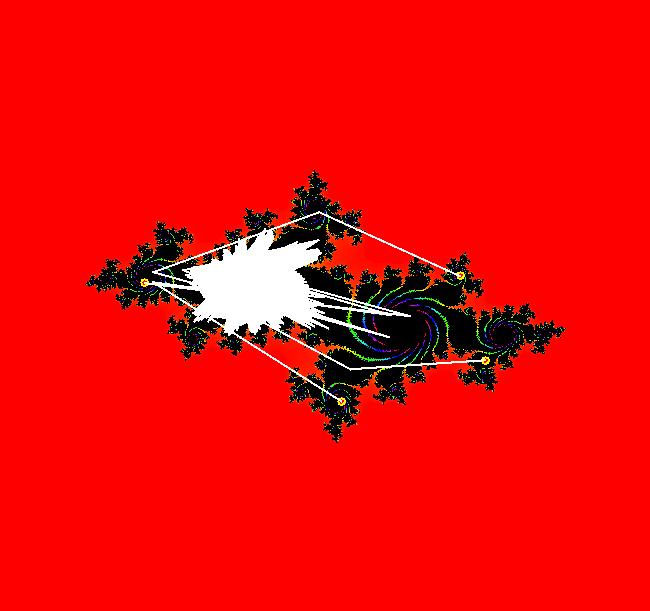
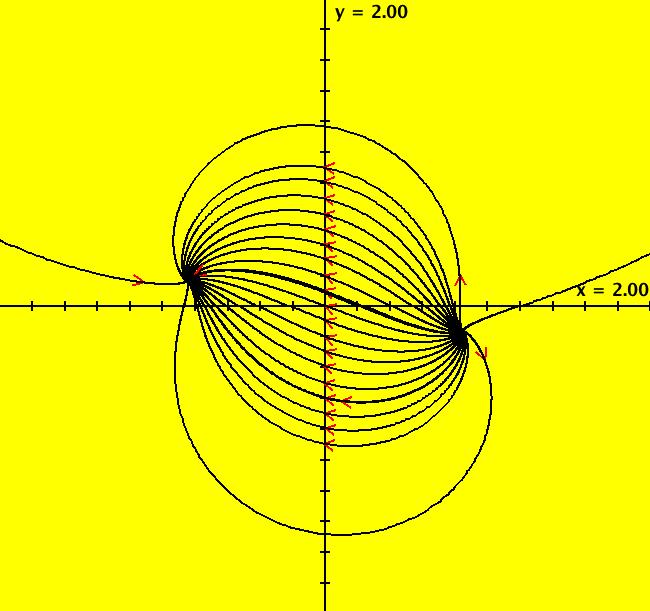
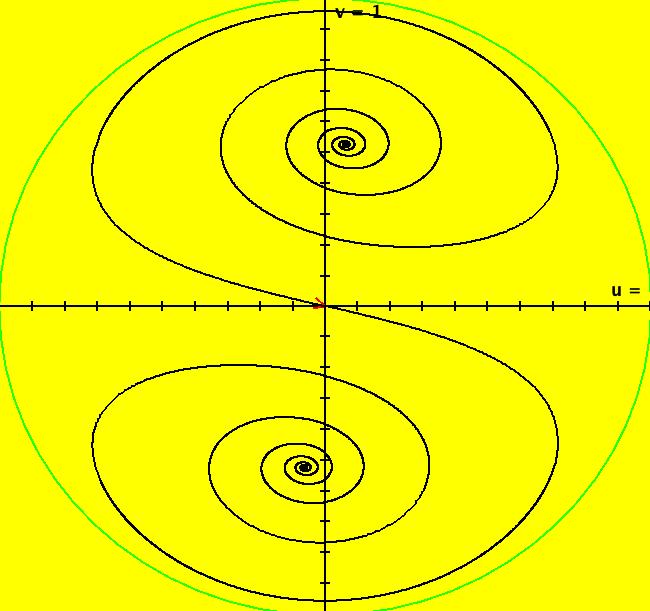
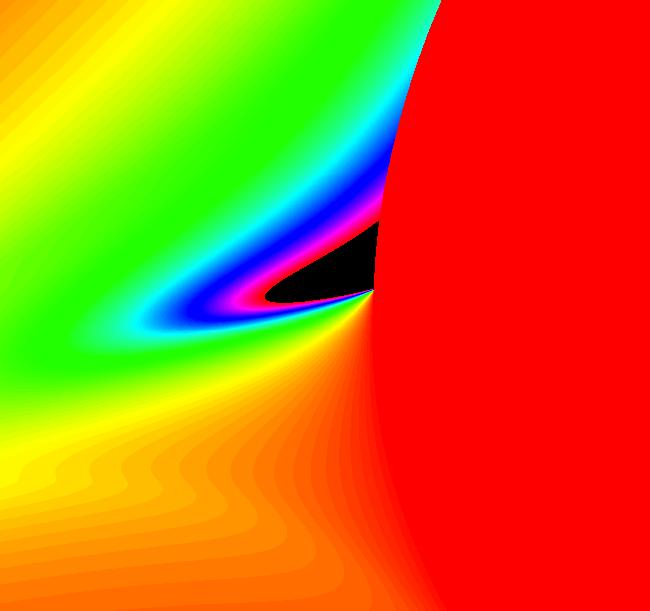
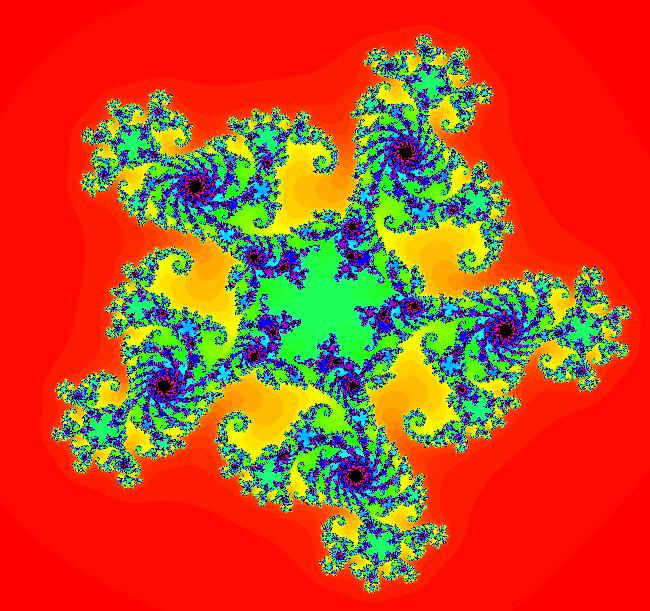
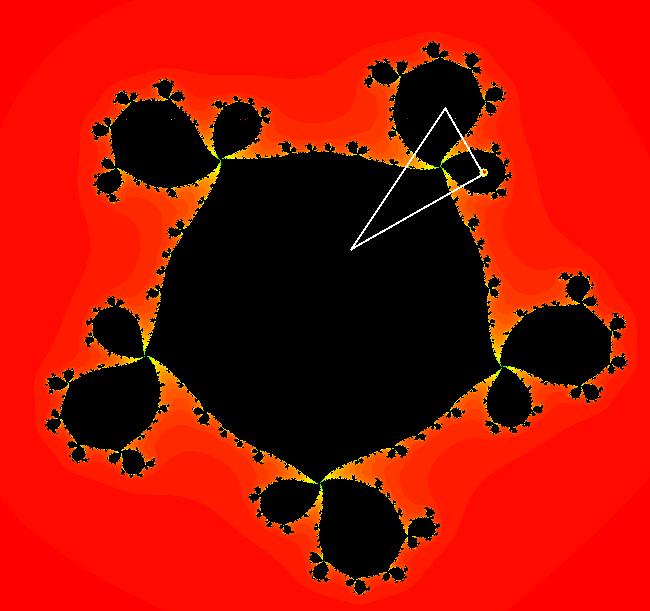
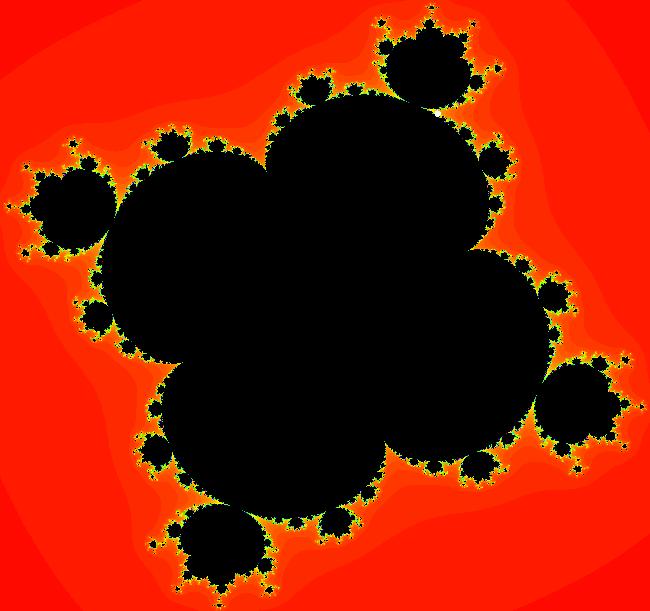
The IC: p(0.000000) = (-0.757776,0.438421) gives a period 5 orbit in the IMap view. The message field below the graphics area indicates which view you are currently in. Notice that the message field says: IMap ... and the text on the viewing state button is EMap. Toggle to the EMap view then to the Ode view then back to the IMap view. Aside ~~~~~~~~~~~~~~~~~~~~~~~~~~~~~~~~~~~~~~~~~~ If your graphics area is about 5 inches by 5 inches, and your screen has 100 pixels/inch, a redraw visits 250,000 pixels and may do up to 100 evaluations of the vector field at each pixel - so to generate an EMap your computer may be doing as many 25,000,000 evaluations of x^2-y^2+p and 2*x*y+q. If the color of the EMap is mostly on the red/yellow end of the color chart the total number of evaluations is the least (fastest redraw). If it is mostly black the total number of evaluations is 100 times larger (slowest redraw). Zoom way in on a red area to see how long a redraw takes then try zooming way in on a black area to see how long a redraw takes. ~~~~~~~~~~~~~~~~~~~~~~~~~~~~~~~~~~~~~~~~~~~ Get into the EMap view, use alt-click to center the view at an interesting point, then zoom in to see the Julia set at a smaller scale. You can also center and zoom-in by creating a selection circle at a point of interest. Move the cursor to the point of interest, then with the control key down, move away from the point and release the control key. Click the Update button in the Graphics Settings window to complete the center and zoom-in. Vary p and/or q to see what happens. Use the "Adj Ctrl Params..." to change the parameter values. Image 1: IMap view with a period 5 orbit. Image 2: IMap 3D/(t,x) view of the period 5 orbit with hMax = 100. Image 3: EMap view. Image 4: Ode view
|
|
View/Sys/Gal: EMap "c = -.52+.57*i, EMap" in "EMapExs."
Range: (vMax,vMin) = (0.076,-0.318), (hMin,hMax) = (0.235,0.587)
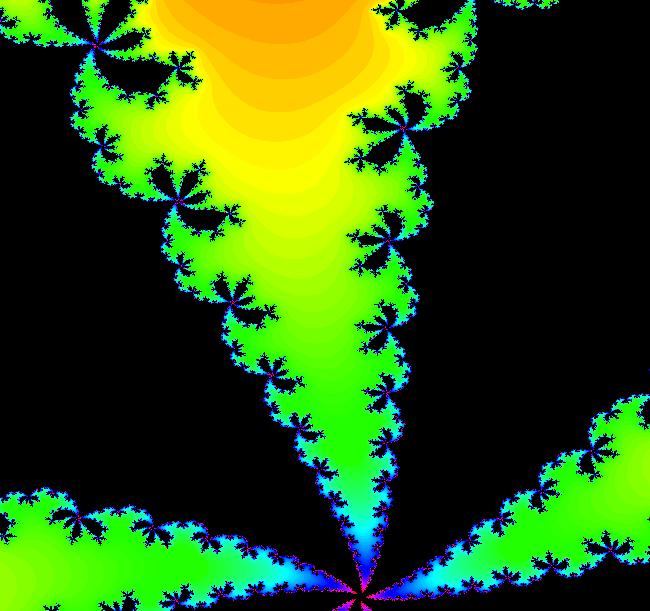
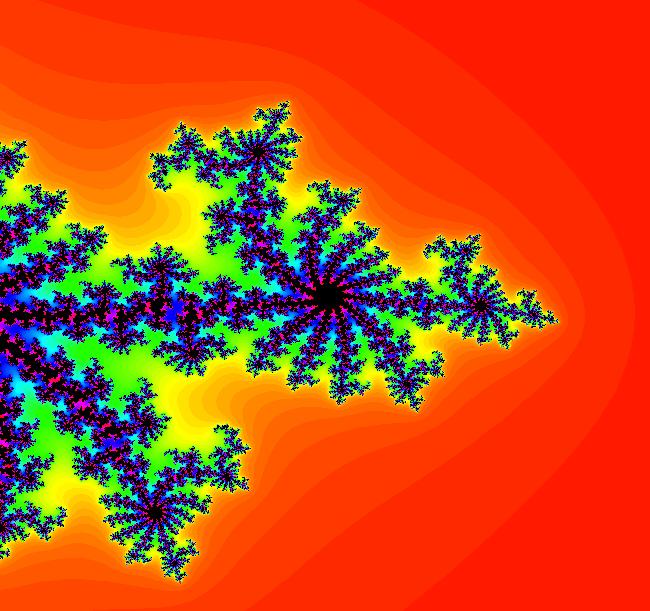
VFld: (x^2-y^2+p,2*x*y+q), p = -.52; q = .57; This iteration is defined by: x <- x^2-y^2+p, y <- 2*x*y+q. Parameters are: p = -.52; q = .57; Center on some point then zoom in. Image 1: EMap view. Image 2: Zoomed in EMap view showing the fractal nature of the image.
|
|
|
View/Sys/Gal: EMap "c = -.69+.28*i, shown on the Mandelbrot set " in "EMapExs."
Range: (vMax,vMin) = (2.000,-2.000), (hMin,hMax) = (-2.000,2.000)
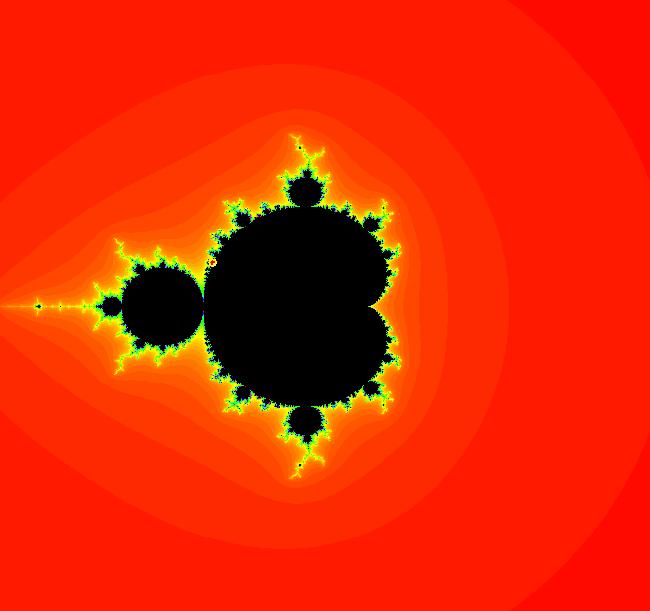
VFld: (x,y,z^2-w^2+x,2*z*w+y) This 4D0P system of odes is defined by the equations: dx/dt = x, dy/dt = y, dz/dt = z^2-w^2+x, dw/dt = 2*z*w+y. 4D ICs: (x,y,z,w) = (-.69,.28,0,0) Turn on "Show 2D IMap Orbit Sequence" then go to the EMap view. Image 1: EMap view of the Mandelbrot set. The red dot shows the point (p,q) = (-.69,.28) near the left edge of the Mandelbrot set corresponding to the 2D EMap (Julia set) shown in the EMap view of the previous system: "c = -.69+.28*i" If you use 4D ICs with (z0,w0) close to (0,0), but not equal to (0,0), you get a mangled version of a Mandelbrot set. Note: For any 2D2P system you can get what corresponds to the "Mandelbrot set" by clicking the 4D0P button.
|
|
|
View/Sys/Gal: EMap "c = -.7128-.2809*i, EMap" in "EMapExs."
Range: (vMax,vMin) = (0.746,-0.404), (hMin,hMax) = (0.571,1.642)
VFld: (x^2-y^2+p,2*x*y+q), p = -.7128; q = -.2809; This iteration is defined by: x <- x^2-y^2+p, y <- 2*x*y+q. Parameters are: p = -.7128; q = -.2809; Image 1: EMap view. Try centering, zooming and changing p and/or q. Note: Since there are 100 tic marks in each direction on the sliders, you can only set parameter values to two-digit precision using the sliders in the "Adj Ctrl Params..." dialog window. To set higher precision parameter values, toggle to the Ode view and enter the parameter values by hand. You then need to click the "Update Eqns, Params, Fns" button and use the "Add to Gallery" button on the "OdeSystem" menu to save the new system with the higher precision parameter values.
|
|
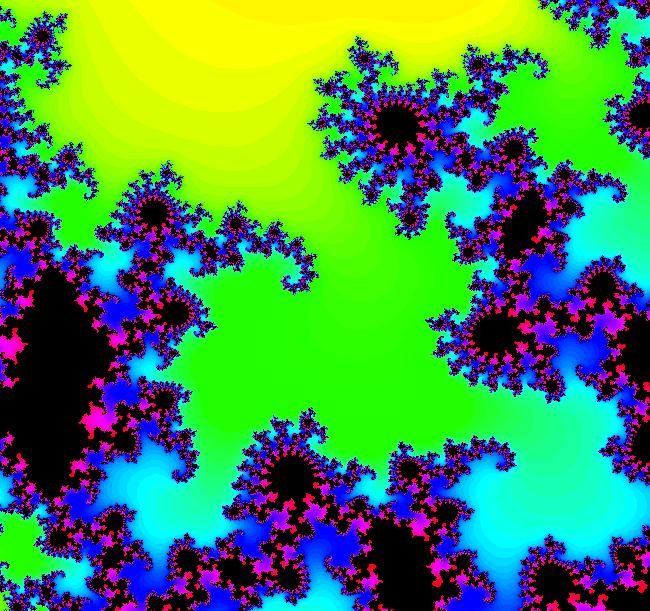
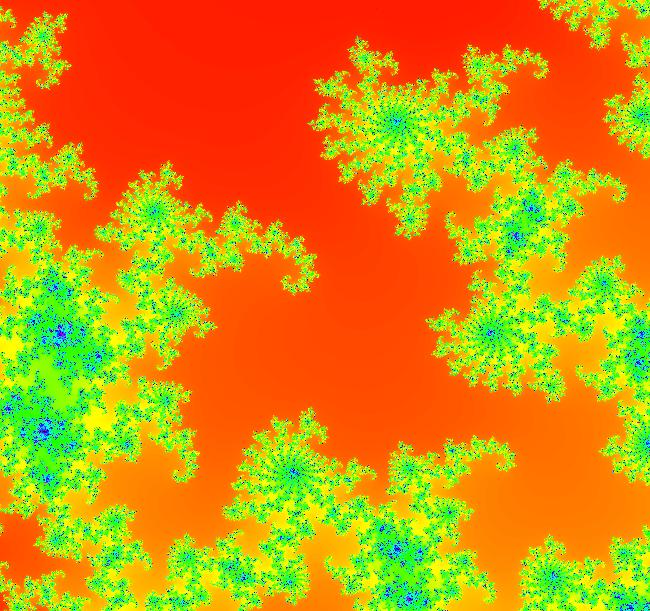
|
View/Sys/Gal: EMap "c = -.7321+.2165*i, EMap" in "EMapExs."
Range: (vMax,vMin) = (0.250,0.050), (hMin,hMax) = (-0.881,-0.681)
VFld: (x^2-y^2+p,2*x*y+q), p = -.7321; q = .2165; This iteration is defined by: x <- x^2-y^2+p, y <- 2*x*y+q. Parameters are: p = -.7321; q = .2165; Image 1: EMap view. The EMapMax view uses a CT 5 times larger than the EMap view. Image 2: Image 2: In the EMapMax view we see that the black regions in the EMap view are no longer regions of the prisoner set.
|
|
|
View/Sys/Gal: EMap "c = -.74671+.11129*i, EMap" in "EMapExs."
Range: (vMax,vMin) = (2.000,-2.000), (hMin,hMax) = (-2.000,2.000)
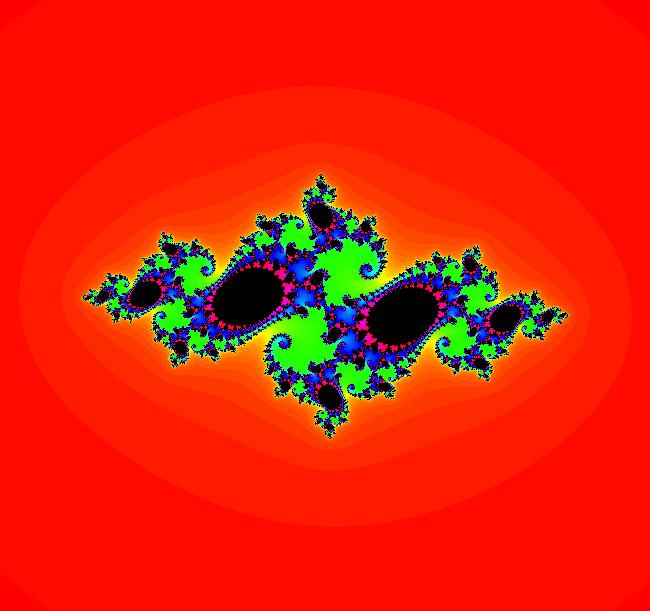
VFld: (x^2-y^2+p,2*x*y+q), p = -.74671; q = .11139; This system is: x <- x^2-y^2+p, y <- 2*x*y+q Parameters are: p = -.74671; q = .11139; Image 1: IMap view.
|
|
|
View/Sys/Gal: EMap "c = -.7553+.1702*i, EMap" in "EMapExs."
Range: (vMax,vMin) = (0.499,0.299), (hMin,hMax) = (-1.081,-0.881)
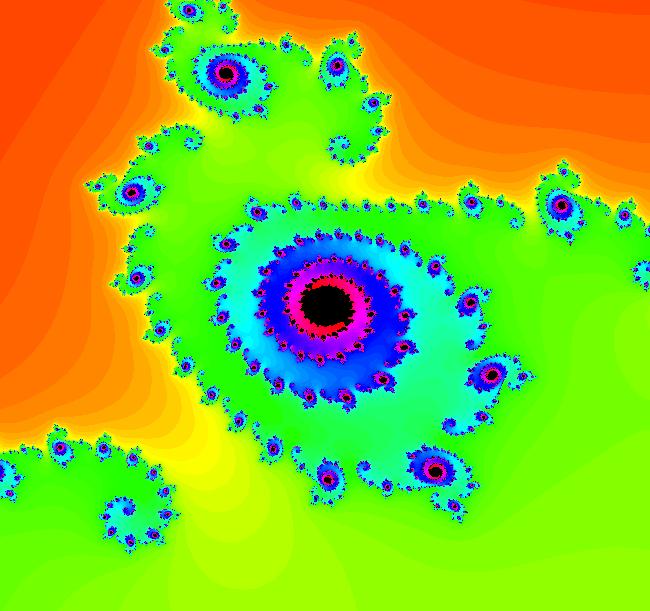
VFld: (x^2-y^2+p,2*x*y+q), p = -.7553; q = .1702; This iteration is defined by: x <- x^2-y^2+p, y <- 2*x*y+q. Parameters are: p = -.7553; q = .1702; Image 1: EMap view.
|
|
|
View/Sys/Gal: EMap "c = -.7553+.1872*i, EMap" in "EMapExs."
Range: (vMax,vMin) = (0.415,0.194), (hMin,hMax) = (0.104,0.313)
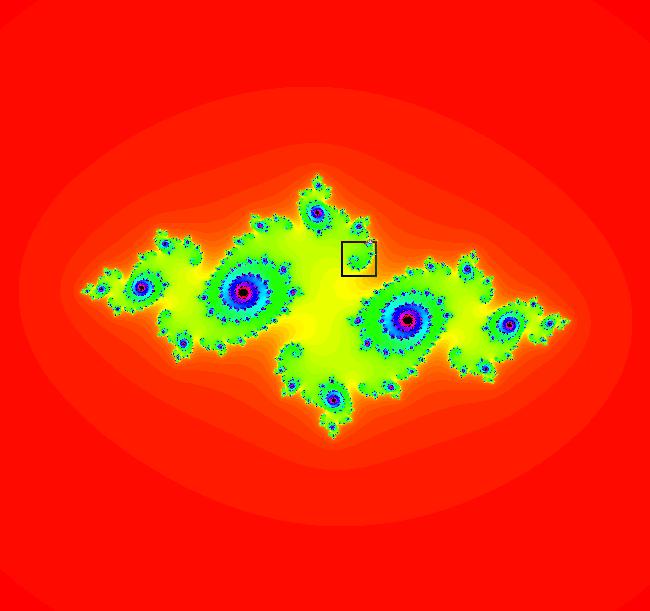
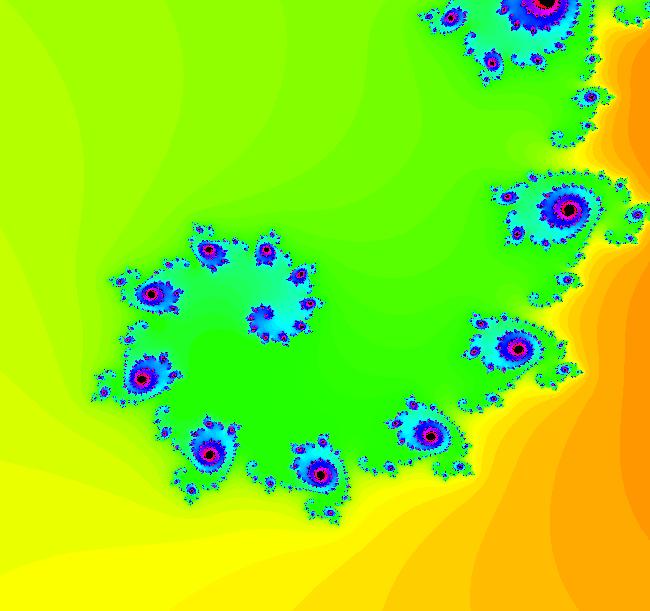
VFld: (x^2-y^2+p,2*x*y+q), p = -.7553; q = .1872; This iteration is defined by: x <- x^2-y^2+p, y <- 2*x*y+q. Parameters are: p = -.7553; q = .1872; Image 1: EMap view. Center on an interesting part of the fractal then zoom in. Center by alt-clicking on a location of interest or ctrl-drag to create a selection square then hit the "Update" button in the "Graphics Settings" window. Image 1: EMap view showing a selection square. Image 2: Zoomed in EMap view.
|
|
|
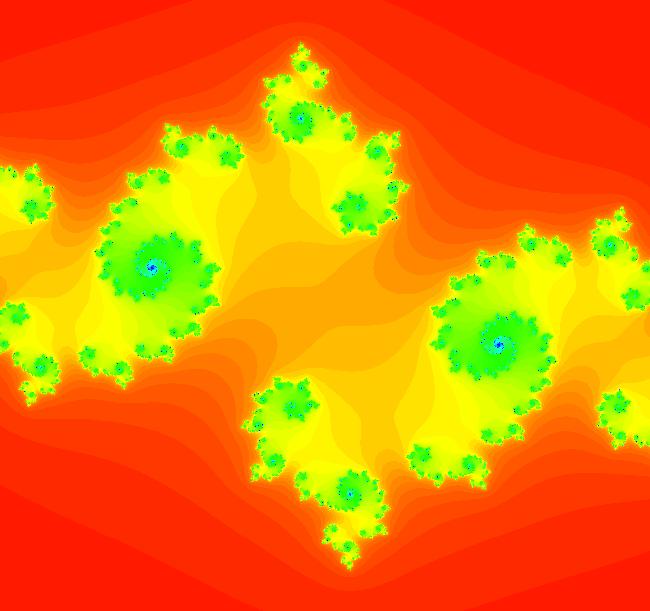
View/Sys/Gal: EMap "c = -.80+.26*i, EMap" in "EMapExs."
Range: (vMax,vMin) = (1.000,-1.000), (hMin,hMax) = (-1.000,1.000)
VFld: (x^2-y^2+p,2*x*y+q), p = -.80; q = .26; This iteration is defined by: x <- x^2-y^2+p, y <- 2*x*y+q. Parameters are: p = -.80; q = .26; Image 1: EMap view. For these parameter values there is no prisoner set.
|
|
|
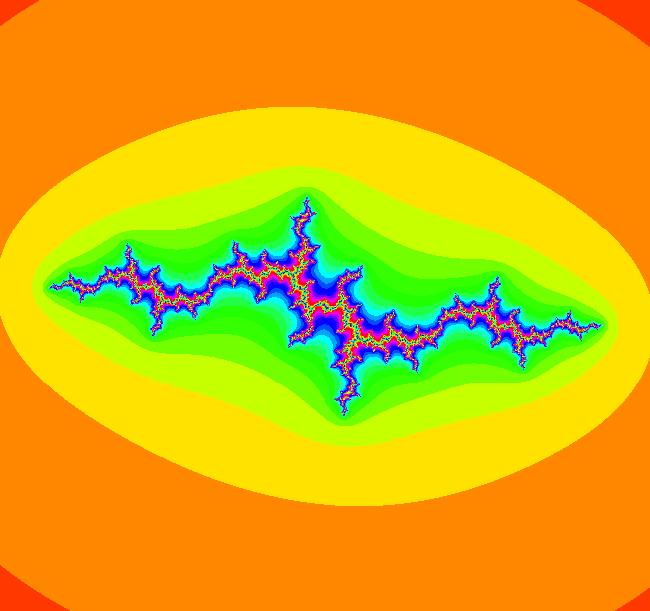
View/Sys/Gal: System "c = -1.20+.29*i, EMap," in gallery "EMapExs," renamed as "c = -1.20+.29*i, EMapCT1."
Range: (vMax,vMin) = (2.000,-2.000), (hMin,hMax) = (-2.000,2.000)
VFld: (x^2-y^2+p,2*x*y+q), p = -1.20; q = .29; This iteration is defined by: x <- x^2-y^2+p, y <- 2*x*y+q. Parameters are: p = -1.20; q = .29; Image 1: EMapCT1 view.
|
|
|
View/Sys/Gal: EMap "c = .3766-.0936*i " in "EMapExs."
Range: (vMax,vMin) = (1.400,-1.400), (hMin,hMax) = (-1.400,1.400)
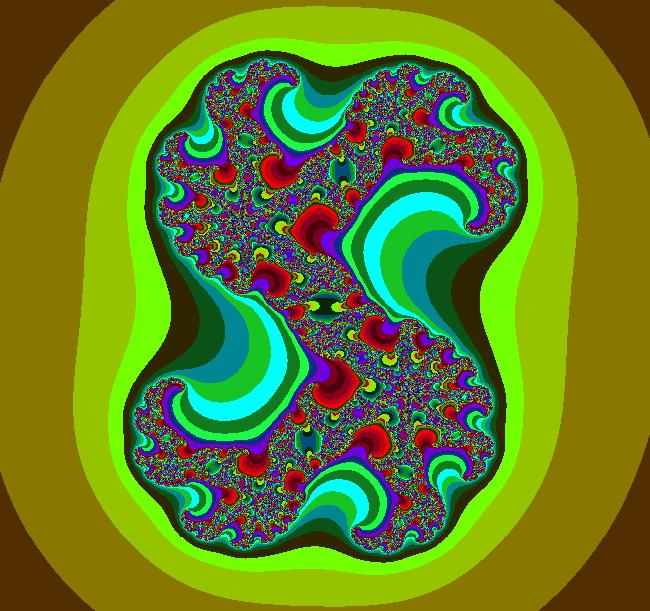
VFld: (x^2-y^2+p,2*x*y+q), p = .3766; q = -.0936; This system of odes is defined by the equations: dx/dt = x^2-y^2+p, dy/dt = 2*x*y+q. Parameters are: p = .3766; q = -.0936; The Ode view is somewhat interesting in R2+ but it is the EMap view that is most interesting. Image 1: Ode R2+ view. Image 2: EMapCT2 R2 view.
|
|
|
View/Sys/Gal: EMap "c = .40, EMapCT5" in "EMapExs."
Range: (vMax,vMin) = (1.500,-1.500), (hMin,hMax) = (-1.500,1.500)
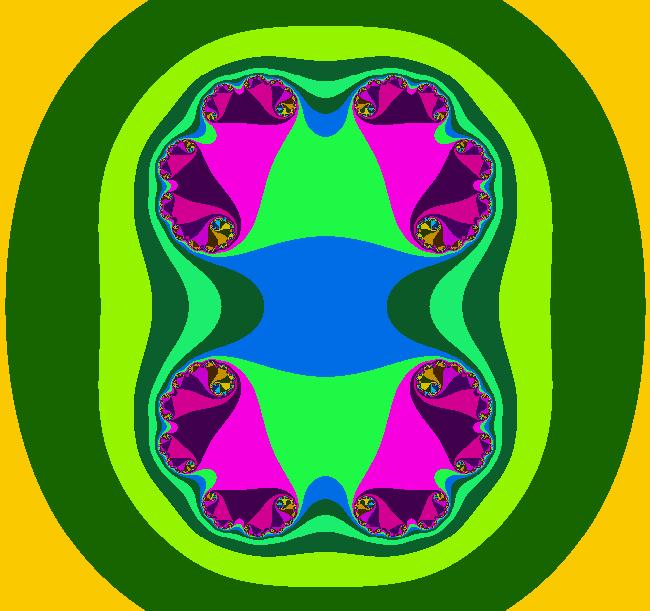
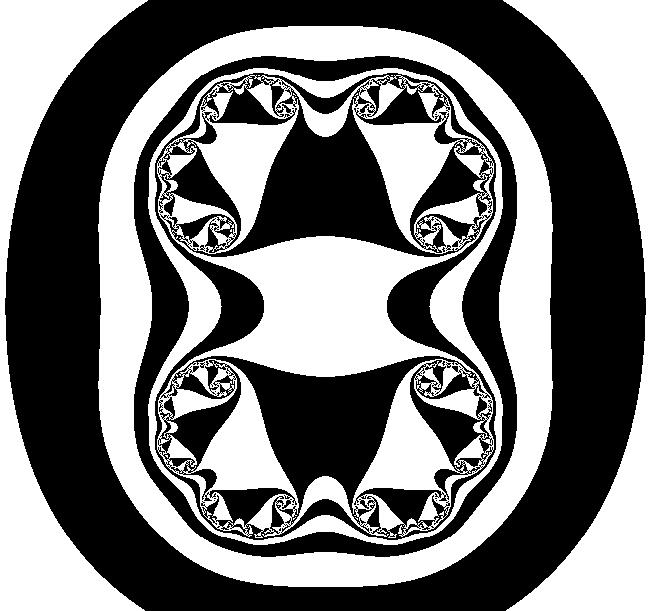
VFld: (x^2-y^2+p,2*x*y+q), p = .40; q = .00; This iteration is defined by: x <- x^2-y^2+p, y <- 2*x*y+q. Parameters are: p = .40; q = .00; Adjust p and q. Try various color tables. Image 1: EMap view with CT5. Image 2: EMap view with CT9.
|
|
|
View/Sys/Gal: EMap "c = 0, basin of attraction = unit disk, EMap" in "EMapExs."
Range: (vMax,vMin) = (1.250,-1.250), (hMin,hMax) = (-1.250,1.250)
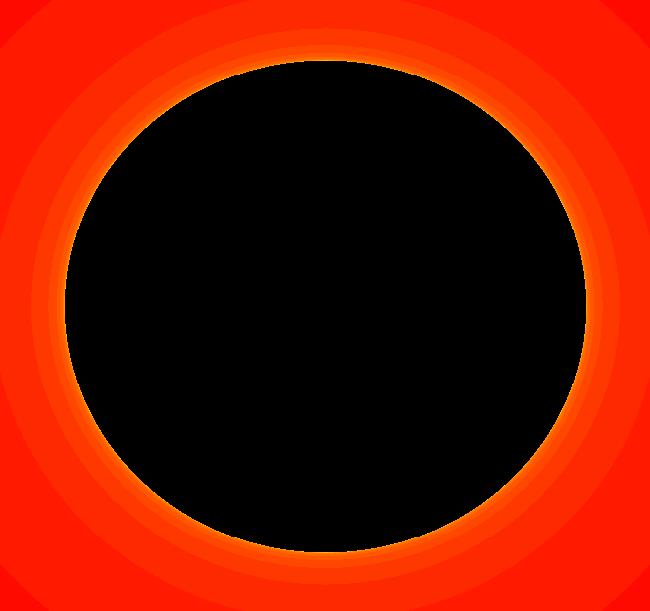
VFld: (x^2-y^2+p,2*x*y+q), p = .00; q = .00; This iteration is defined by: x <- x^2-y^2+p, y <- 2*x*y+q. Parameters are: p = .00; q = .00; Image 1: EMap view. You can use a spreadsheet program to convince yourself that the iteration goes to 0 if |z| <= 1 and to +infinity if |z| > 1 so the basin of attraction, the black region in the EMap view, is a filled in Julia set. The Julia set itself is the unit circle. Another way to see this is to get into the IMap view, start some seeds inside and outside of the unit circle and select "Show 2D IMap Orbit Sequence" on the Help menu.
|
|
|
View/Sys/Gal: IMap "ode/imap/emap" in "EMapExs."
Range: (vMax,vMin) = (7.000,-7.000), (hMin,hMax) = (-7.000,7.000)
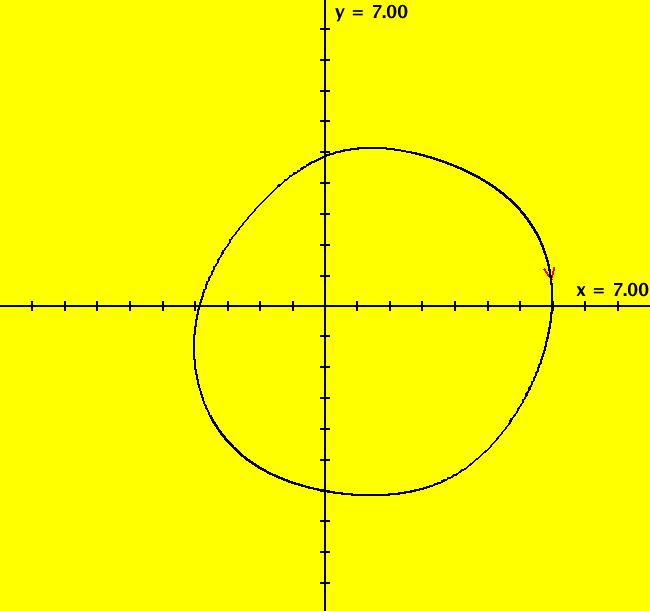
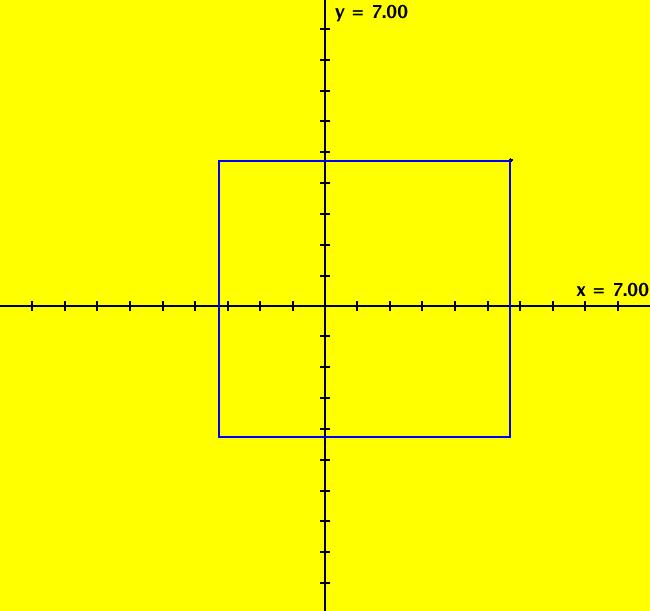
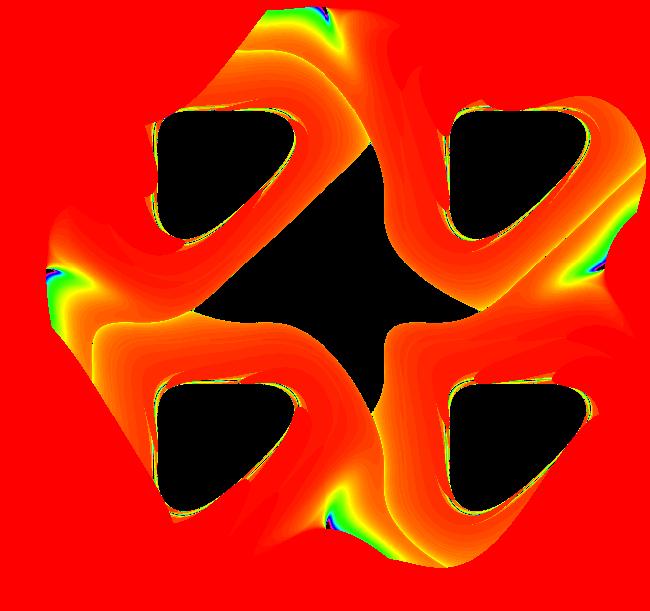
VFld: (y-cos(abs(x)),a-x), a = 1.00; NOTE: This system is also in sample gallery MapExs. This system of odes is defined by the equations: dx/dt = y-cos(abs(x)), dy/dt = a-x Parameters are: a = 1.00; Image 1: In the Ode view all trajectories go to a single stable trajectory at (4.864624,0.604224) with period 6.488. Image 2: In the IMap view every orbit is either chaotic or periodic with period n*4. This is a period 4 orbit at (3.977022,3.306162). Image 3: In the EMapMax view there are three basins of attraction - the inner black region, the four large black regions and the four small outer black regions (you need to zoom in to see the detail). Image 4: EMapMax view of an outer basin of attraction.
|
|
|
View/Sys/Gal: EMap "power flow w/params, p=.55, q=1, EMap" in "EMapExs."
Range: (vMax,vMin) = (1.700,-1.700), (hMin,hMax) = (-1.700,1.700)
VFld: (y*(5*x^4-10*x^2*y^2+y^4)/4+p,-x*(x^4-10*x^2*y^2+5*y^4)/4+q), p = .55; q = 1.00; This system is: x <- y*(5*x^4-10*x^2*y^2+y^4)/4+p, y <- -x*(x^4-10*x^2*y^2+5*y^4)/4+q Parameters are: p = .55; q = 1.00; This system came from the "power flow" example in gallery AGFExamples. Image 1: EMap view. Try adjusting p and q. Try various color tables.
|
|
|
View/Sys/Gal: EMap "power flow w/params, p=.82454, q=.73647, EMap" in "EMapExs."
Range: (vMax,vMin) = (1.700,-1.700), (hMin,hMax) = (-1.700,1.700)
VFld: (y*(5*x^4-10*x^2*y^2+y^4)/4+p,-x*(x^4-10*x^2*y^2+5*y^4)/4+q), p = .82454; q = .73647; This iteration is defined by: x <- y*(5*x^4-10*x^2*y^2+y^4)/4+p, y <- -x*(x^4-10*x^2*y^2+5*y^4)/4+q. Parameters are: p = .82454; q = .73647; EMap CT: 0 Image 1: EMap view, per-3 attractor. The EMapMax view is the same as the EMap view for this system. The prisoner set is the basin of attraction and the per-3 orbit is the only attractor.
|
|
|
View/Sys/Gal: EMap "power flow's bifurcation diagram, EMap" in "EMapExs."
Range: (vMax,vMin) = (1.600,-1.600), (hMin,hMax) = (-1.600,1.600)
VFld: (x,y,w*(5*z^4-10*z^2*w^2+w^4)/4+x,-z*(z^4-10*z^2*w^2+5*w^4)/4+y) This system of odes is defined by the equations: dx/dt = x, dy/dt = y, dz/dt = w*(5*z^4-10*z^2*w^2+w^4)/4+x, dw/dt = -z*(z^4-10*z^2*w^2+5*w^4)/4+y. Image 1: This is the first previous power flow's "Mandelbrot set" or bifurcation diagram. The white dot is at (x,y,z,w) = (.55,1,0,0), i.e. at the 2D system's "(p,q)" value of (.55,1). The EMap image for the 2D system is in the 2D system's phase space. To force the 4D system to open in the EMap view use "EMap" in the 4D system's name. Another way to get to the EMap view when starting in the Ode view is to turn on "Show 2D IMap Orbit Sequence" and then go to the EMap view.
|
|

|
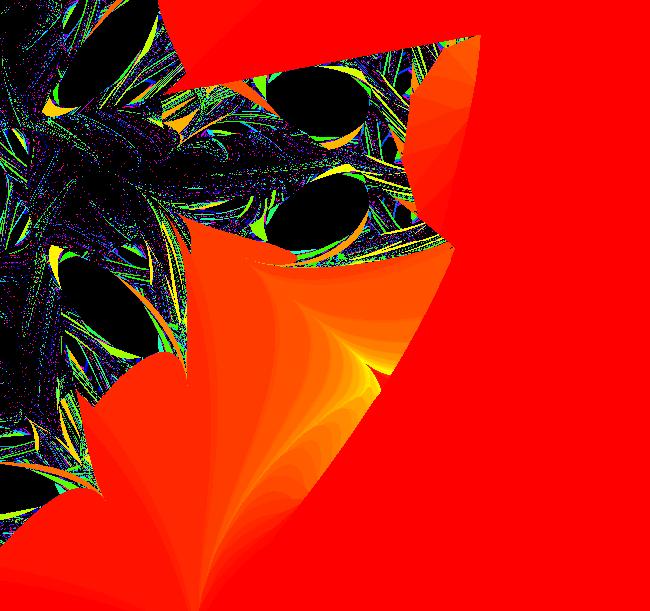
View/Sys/Gal: EMap "what is Art? 1, EMap" in "EMapExs."
Range: (vMax,vMin) = (2.641,-1.398), (hMin,hMax) = (4.123,7.884)
VFld: (y-sgn(x)*sqrt(abs(b*x-c)),a-x), a = .99; b = .96; c = .84; This iteration is defined by: x <- y-sgn(x)*sqrt(abs(b*x-c)), y <- a-x. Parameters are: a = .99; b = .96; c = .84; Try some other color tables. Image 1: EMap view. Image 2: EMapMax view.
|
|
|
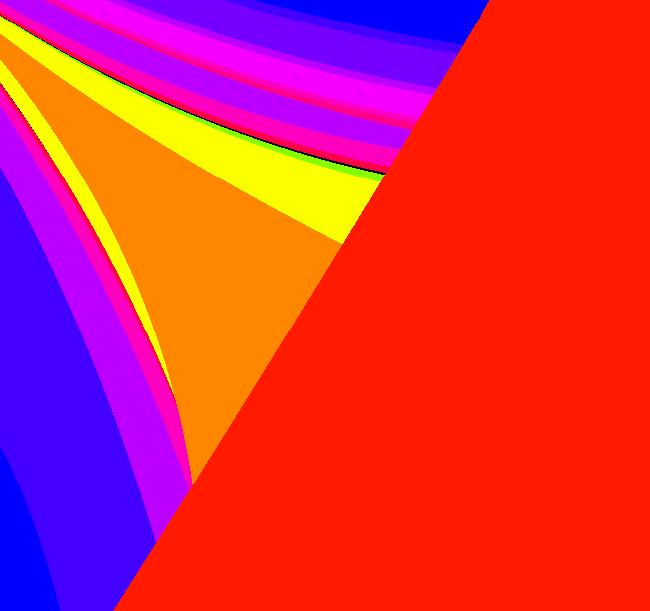
View/Sys/Gal: EMap "what is Art? 2, EMap" in "EMapExs."
Range: (vMax,vMin) = (0.234,0.032), (hMin,hMax) = (6.265,6.454)
VFld: (y-sgn(x)*sqrt(abs(b*x-c)),a-x), a = .99; b = .96; c = .84; This iteration is defined by: x <- y-sgn(x)*sqrt(abs(b*x-c)), y <- a-x. Parameters are: a = .99; b = .96; c = .84; Try some other color tables. Image 1: EMap view.
|
|

|
View/Sys/Gal: EMap "what is Art? 3, EMap" in "EMapExs."
Range: (vMax,vMin) = (2.959,-2.360), (hMin,hMax) = (3.767,8.063)
VFld: (y-sgn(x)*sqrt(abs(b*x-c)),a-x), a = .48; b = .96; c = .84; This iteration is defined by: x <- y-sgn(x)*sqrt(abs(b*x-c)), y <- a-x. Parameters are: a = .48; b = .96; c = .84; Try some other color tables. Image 1: EMap view.
|
|

|
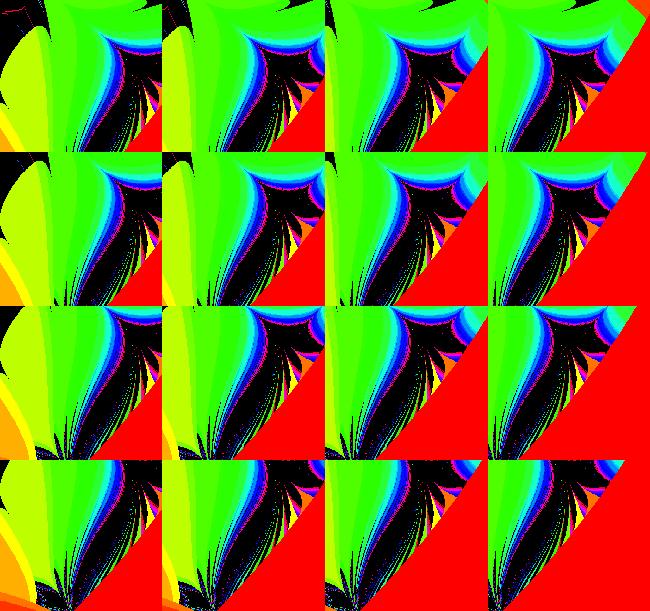
View/Sys/Gal: EMap "what is Art? 4, EMap" in "EMapExs."
Range: (vMax,vMin) = (0.445,-2.405), (hMin,hMax) = (4.608,6.752)
VFld: (y-sgn(x)*sqrt(abs(b*x-c)),a-x), a = .48; b = .96; c = .84; This iteration is defined by: x <- y-sgn(x)*sqrt(abs(b*x-c)), y <- a-x. Parameters are: a = .48; b = .96; c = .84; Image 1: EMap view. Try some other color tables. This image also makes a nice shifted-pattern quilt. Right-shift-click in the graphics area to see the quilt. Image 2: Shifted-pattern quilt view.
|
|

|
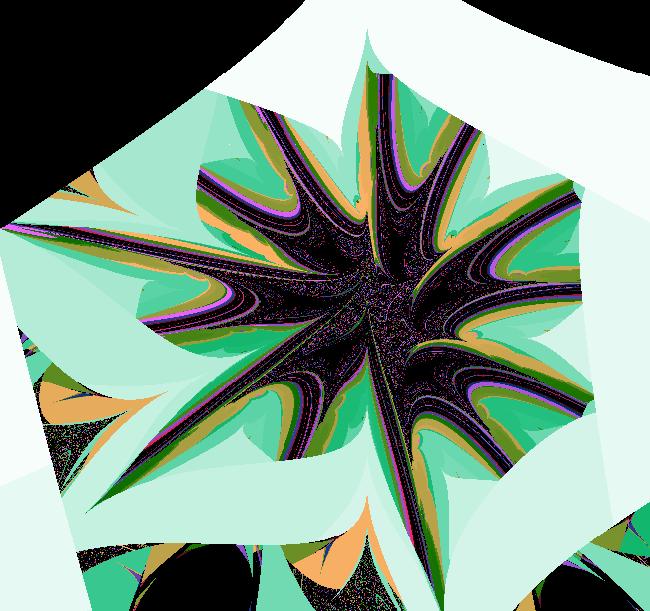
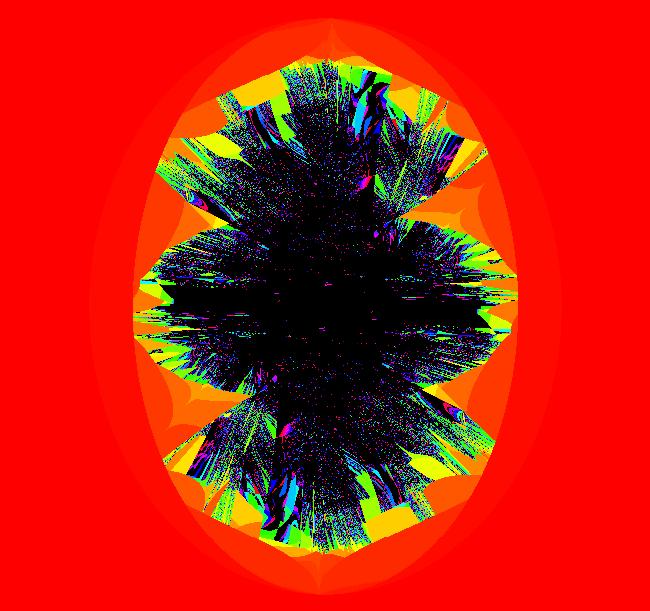
View/Sys/Gal: EMap "what is Art? 5, EMap" in "EMapExs."
Range: (vMax,vMin) = (6.406,4.082), (hMin,hMax) = (-2.021,-0.113)
VFld: (y-sgn(x)*sqrt(abs(b*x-c)),a-x), a = .540; b = -.890; c = .840; This iteration is defined by: x <- y-sgn(x)*sqrt(abs(b*x-c)), y <- a-x. Parameters are: a = .540; b = -.890; c = .840; Image 1: EMap view. Try some other color tables. Image 2: EMapMax, CT 7, shifted and zoomed a bit.
|
|
|
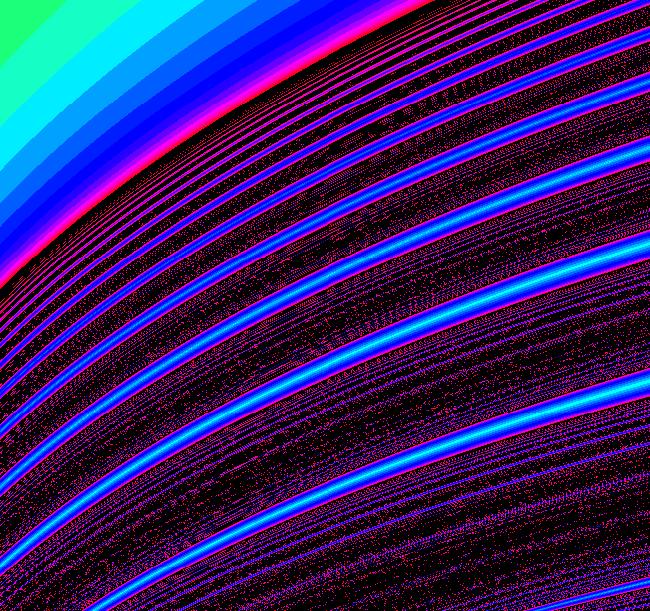
View/Sys/Gal: EMap "what is Art? 5, bifurcation diagram EMap" in "EMapExs."
Range: (vMax,vMin) = (7.475,-7.475), (hMin,hMax) = (-6.827,6.827)
VFld: (x,y,w-sgn(z)*sqrt(abs(y*z-1)),x-z) This system of odes is defined by the equations: dx/dt = x, dy/dt = y, dz/dt = w-sgn(z)*sqrt(abs(y*z-1)), dw/dt = x-z. Image 1: This is the parameter space EMap view (bifurcation diagram) of the "What is Art?" system where c has been set to 1.
|
|
|
View/Sys/Gal: EMap "what is Art? 6, EMap" in "EMapExs."
Range: (vMax,vMin) = (2.856,2.670), (hMin,hMax) = (1.874,2.005)
VFld: (y-sgn(x)*sqrt(abs(b*x-c)),a-x), a = 4.300; b = .710; c = 1.300; This iteration is defined by: x <- y-sgn(x)*sqrt(abs(b*x-c)), y <- a-x. Parameters are: a = 4.300; b = .710; c = 1.300; Image 1: EMap view. Try some other color tables.
|
|
|
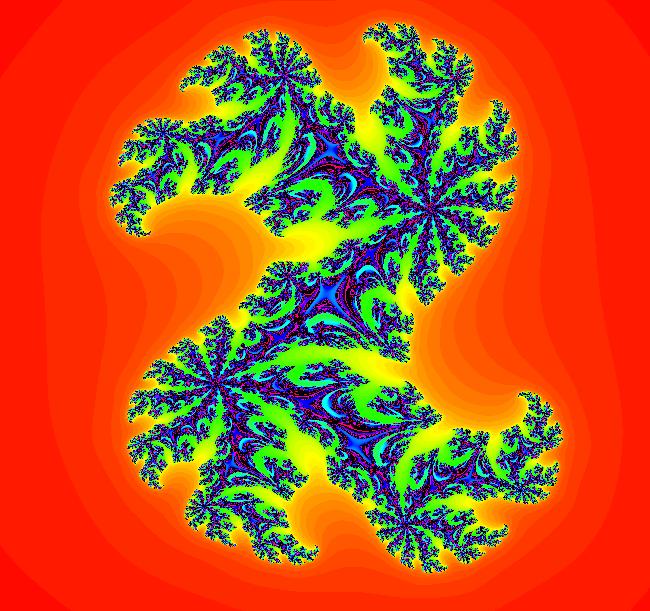
View/Sys/Gal: EMap "z <- z^2+c*z, p = .82; q = .69; as an EMap" in "EMapExs."
Range: (vMax,vMin) = (0.862,-1.638), (hMin,hMax) = (-1.657,0.843)
VFld: (p*x-q*y+x^2-y^2,p*x+q*y+2*x*y), p = .82; q = .69; This iteration is defined by: x <- p*x-q*y+x^2-y^2, y <- p*x+q*y+2*x*y. Parameters are: p = .82; q = .69; Image 1: EMap view.
|
|
|
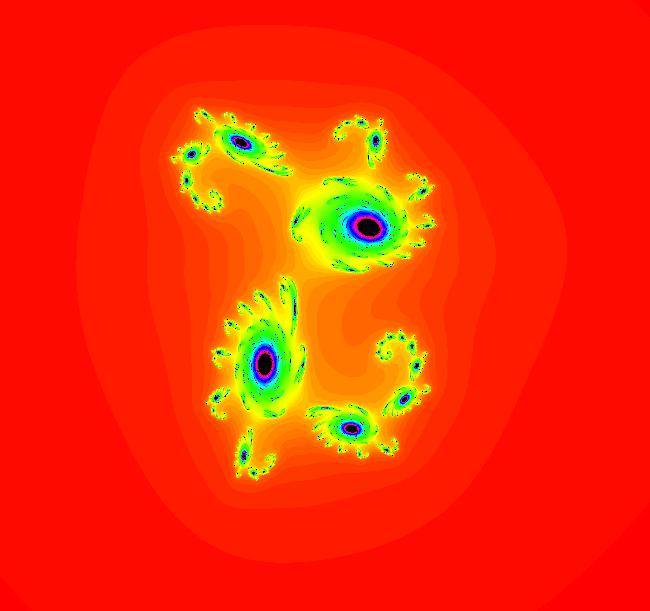
View/Sys/Gal: EMap "z <- z^2+c*z, p=.60, q=.85; as an EMap" in "EMapExs."
Range: (vMax,vMin) = (1.495,-2.505), (hMin,hMax) = (-2.275,1.725)
VFld: (p*x-q*y+x^2-y^2,p*x+q*y+2*x*y), p = .60; q = .85; This iteration is defined by: x <- p*x-q*y+x^2-y^2, y <- p*x+q*y+2*x*y. Parameters are: p = .60; q = .85; Image 1: EMap view. Vary p and/or q.
|
|


