Click on an image to go directly to a system or scroll to see all of the systems in this gallery.
 |
 |
 |
 |
 |
 |
 |
 |
 |
 |
 |
 |
 |
 |
 |
 |
 |
 |
 |
 |
 |
 |
 |
 |
 |
 |
 |
 |
 |
 |
 |
 |
 |
 |
 |
 |
 |
 |
 |
 |
 |
 |
 |
 |
 |
 |
 |
 |
 |
 |
 |
 |
 |
 |
 |
 |
 |
 |
 |
 |
 |
 |
 |
 |
 |
 |
 |
 |
 |
 |
 |
 |
 |
 |
 |
 |
 |
 |
 |
 |
 |
 |
 |
 |
 |
 |
 |
 |
 |
 |
 |
 |
 |
 |
 |
 |
 |
 |
 |
 |
 |
 |
 |
 |
 |
 |
 |
 |
 |
 |
 |
 |
 |
 |
 |
 |
 |
 |
 |
 |
 |
 |
 |
 |
 |
 |
 |
 |
 |
 |
 |
 |
 |
 |
 |
 |
 |
 |
 |
 |
 |
 |
 |
 |
 |
 |
 |
 |
 |
 |
 |
 |
 |
 |
 |
 |
 |
 |
 |
 |
 |
 |
 |
 |
 |
| OdeFactory Images and Annotations | |
|
An OdeFactory Slide Show Click on a slide to zoom in. Click "video" to see a video. |
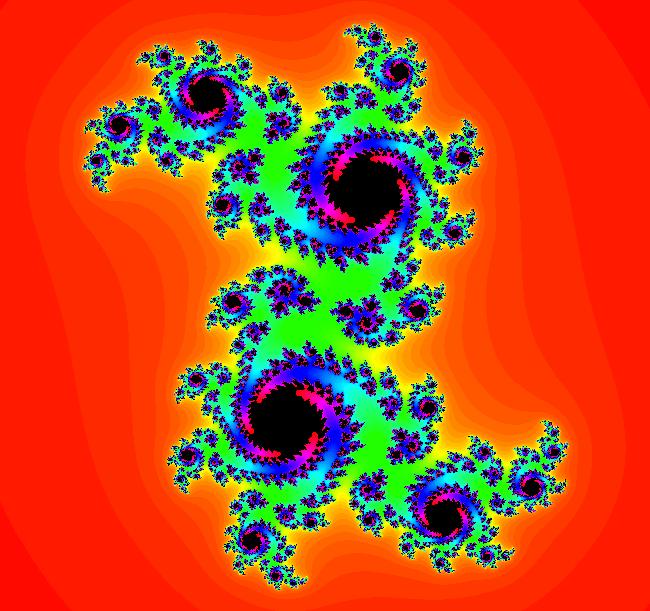
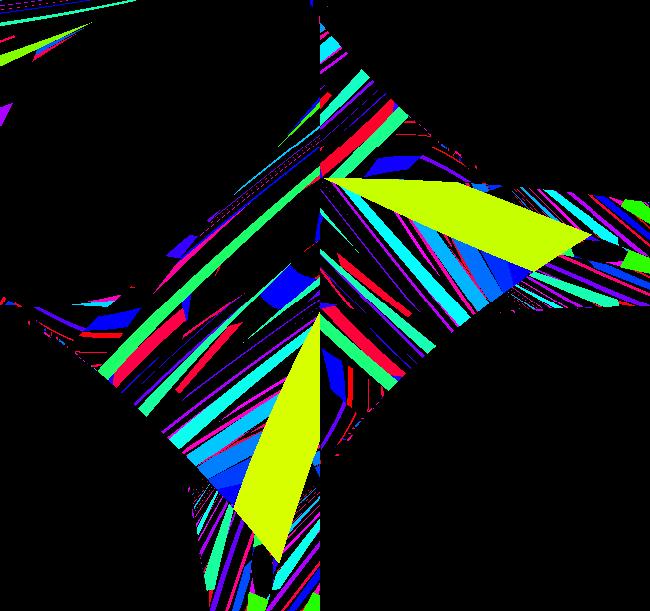
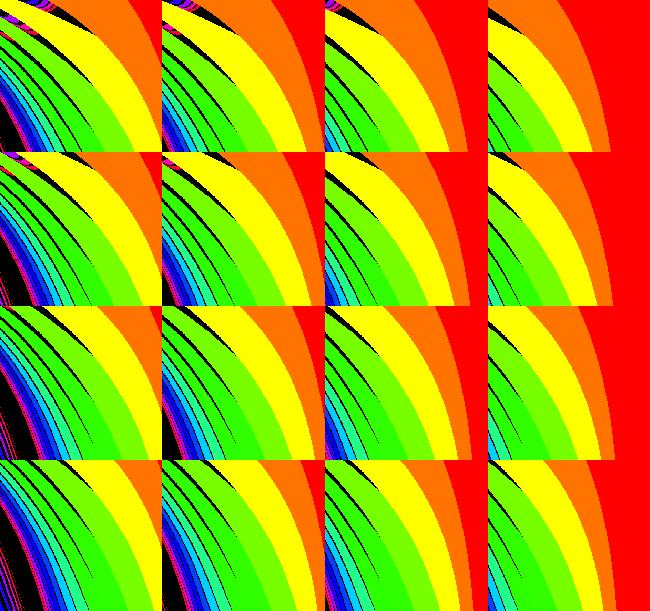
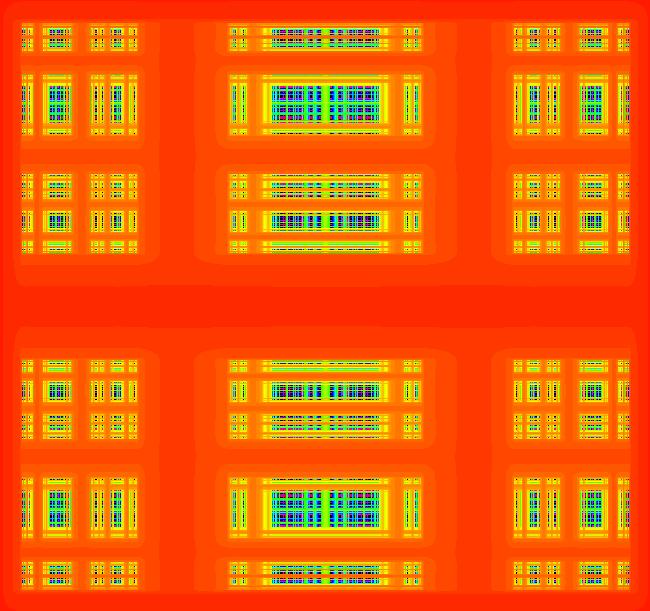
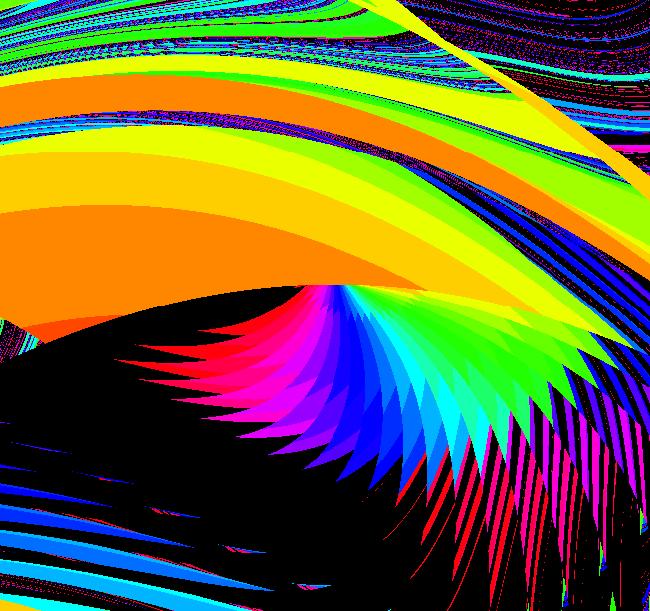
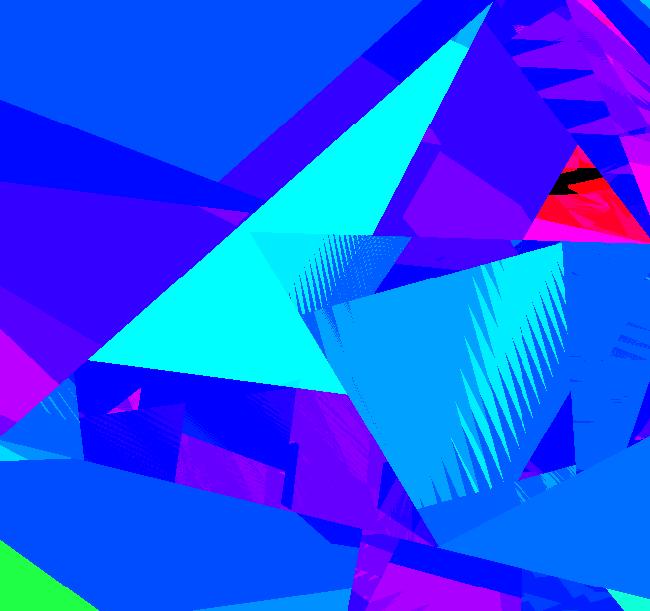
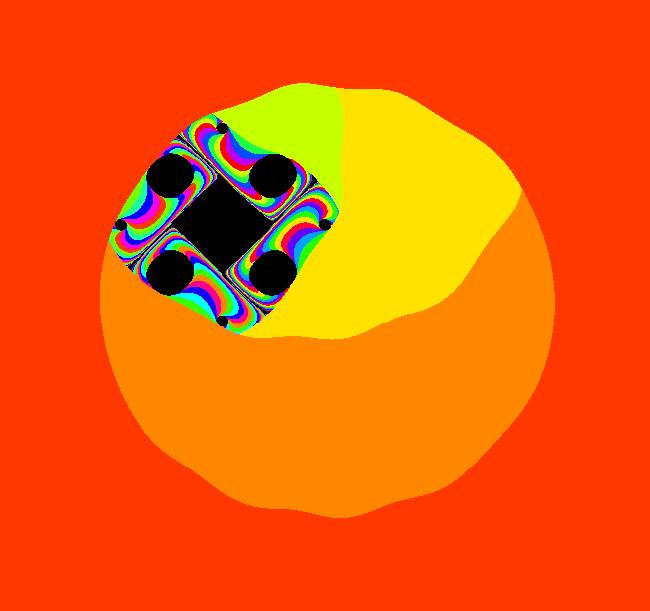
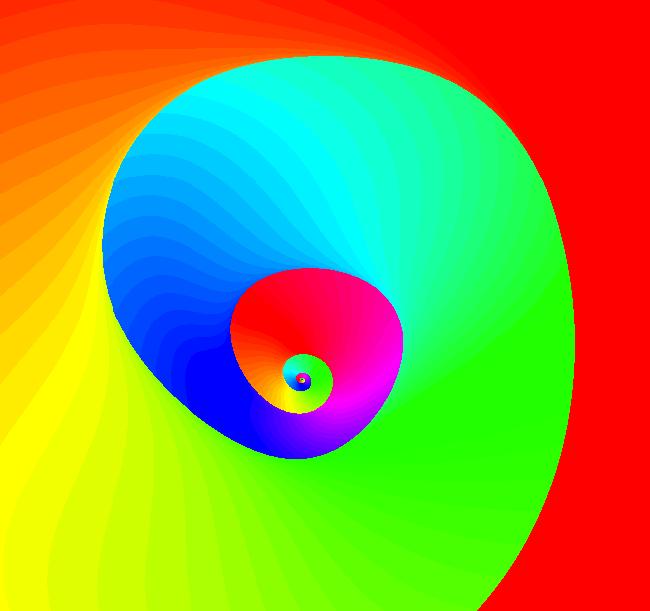
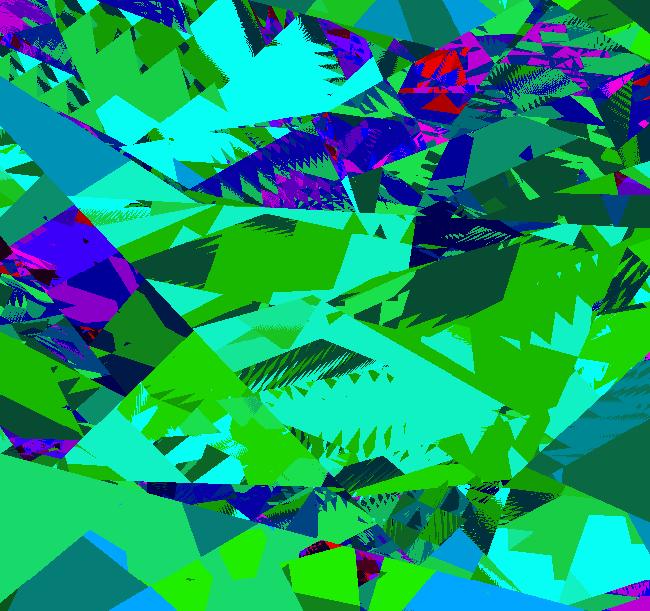
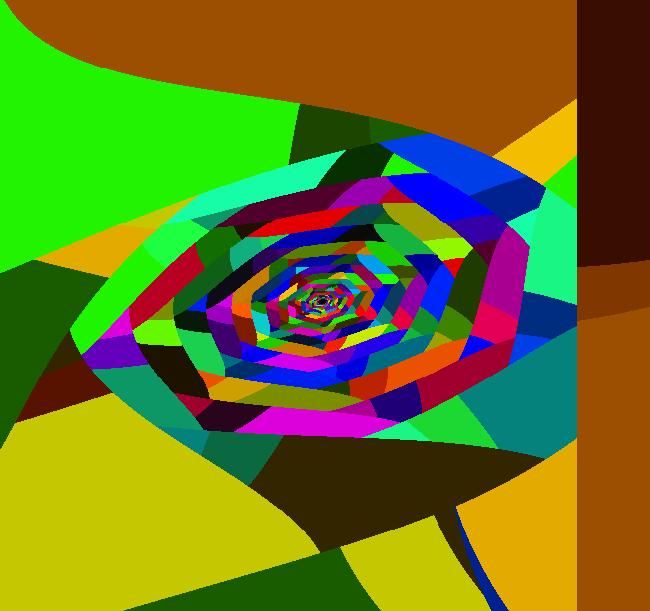
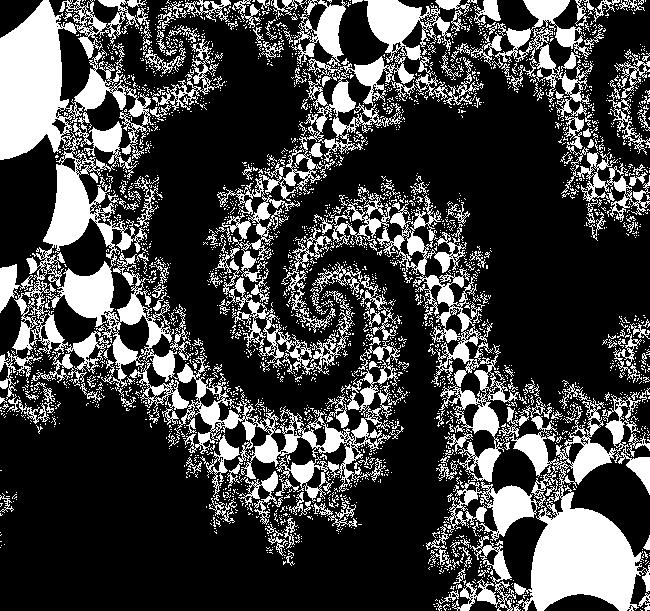
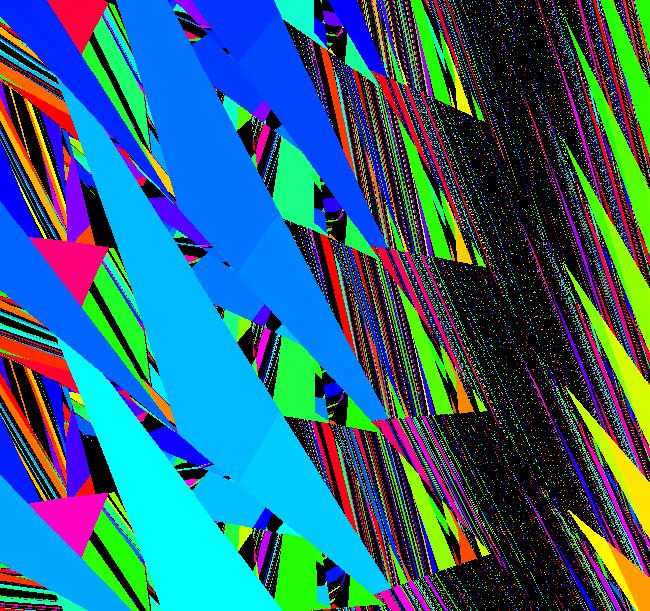
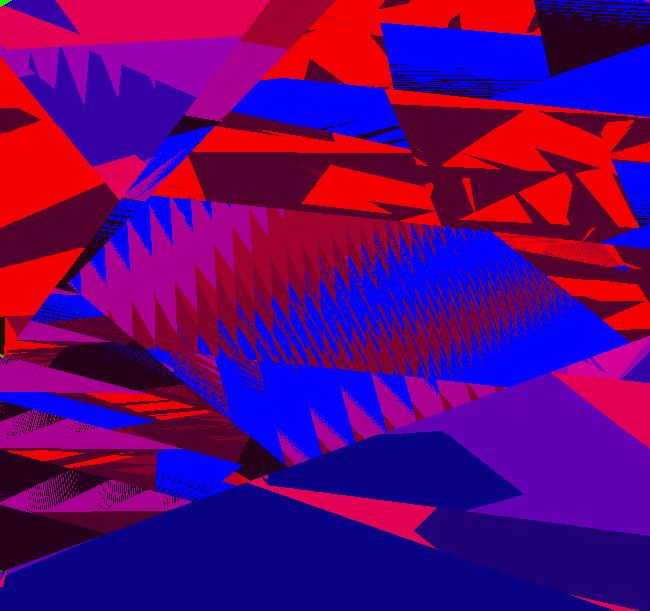
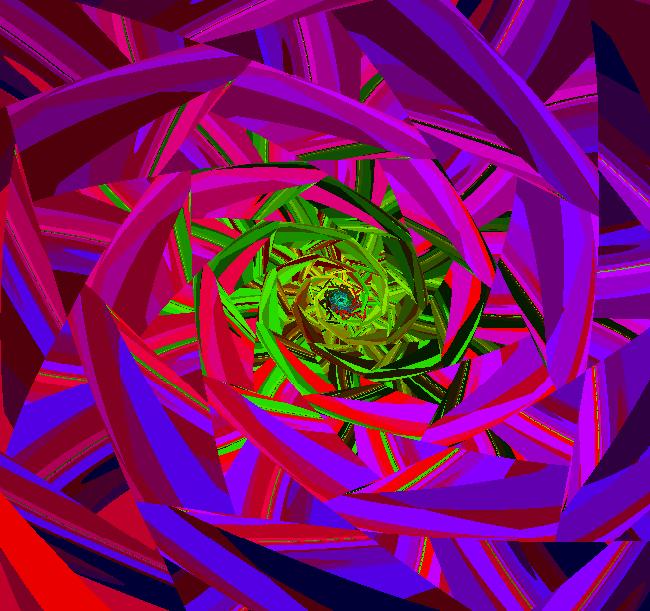
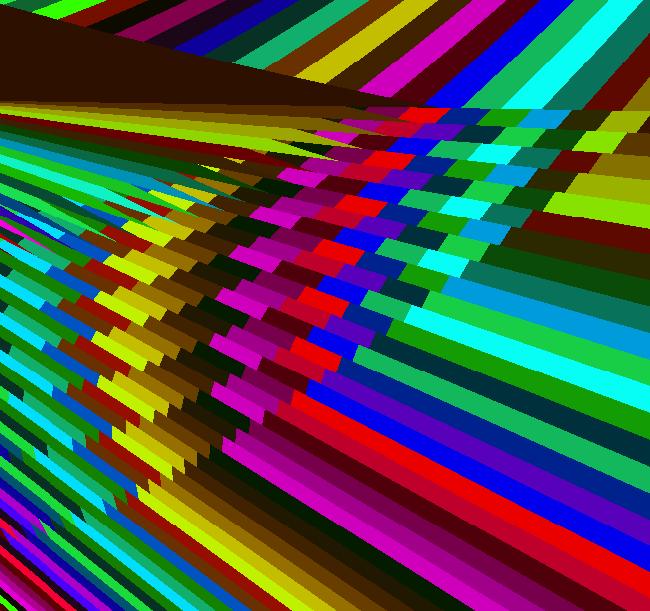
View/Sys/Gal: Ode " Intro to the Interactive Art Gallery" in "ArtGallery." Intro to the Interactive Art Gallery This "Art" gallery is a collection of 2D vector fields which generate interesting interactive Art in the EMap and IMap views. To view an image in the EMap or IMap views it is generally best to choose different settings of the axis parameters and control parameters, hence there is one version of each basic vector field prefaced with EMap and another prefaced with IMap. In the EMap view OdeFactory starts an iteration at each pixel in the graphics area, scanning left to right and top to bottom. The escape-time algorithm, called an EMap in OdeFactory, is used to assign a color to each pixel. Up to 100 iterations may be needed to assign a color to an individual pixel. If the size of the viewing area is doubled, the time required to render the image quadruples. For a Mandelbrot iteration, z <- z^2+c, with complex z and c or x <- x^2-y^2+p, y <- 2*x*y+q with real x, y, p and q, the EMap images are fractals and the black regions are called "basins of attraction." Basins of attraction are regions where all iterates stay close to their starting point. The test to see if a point stays close to where its starting point may involve up to 100 iterations (the number of colors being used) so the least interesting EMaps require the most time to draw. To avoid wasting a lot of time watching uninteresting EMaps being drawn, OdeFactory first samples 1000 random pixels in the viewing area and finds the percent that would be colored black. If the percent is greater than 99, the entire viewing area is painted black without further computations. Unlike the Mandelbrot iteration, which is defined by smooth functions, most of the EMaps in this gallery are defined by non-smooth functions commonly used to define IMaps. IMaps are generated using a few "seed" points, which are just ICs for trajectories in the Ode view. To create you own version of an IMap clear the view then start clicking in the viewing area to create seed points. Instead of getting trajectories (continuous curves) you will get "orbits" consisting of discrete dots. The various orbits have different colors but the colors only get updated when the display is updated. To force a display update, click the "Center" button. The strings "EMap" or "IMap" in the system names tell OdeFactory to open the system in the EMap or IMap view as opposed to the Ode view. When there are a string of four 1's and/or 0's following "IMap" the 1's and 0's toggle the items: Show 2D IMap Orbit Sequence Show Approximate IMap Orbit Period Hide Axes Hide Arrowheads/Seeds on/off.
|
|
|
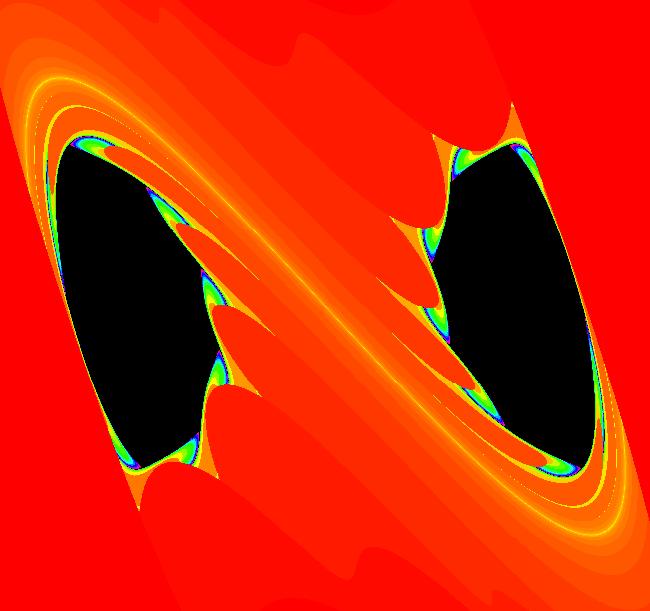
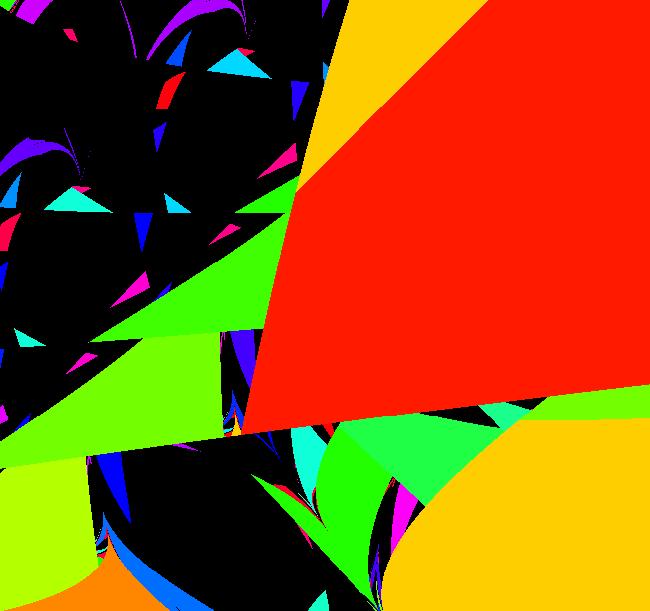
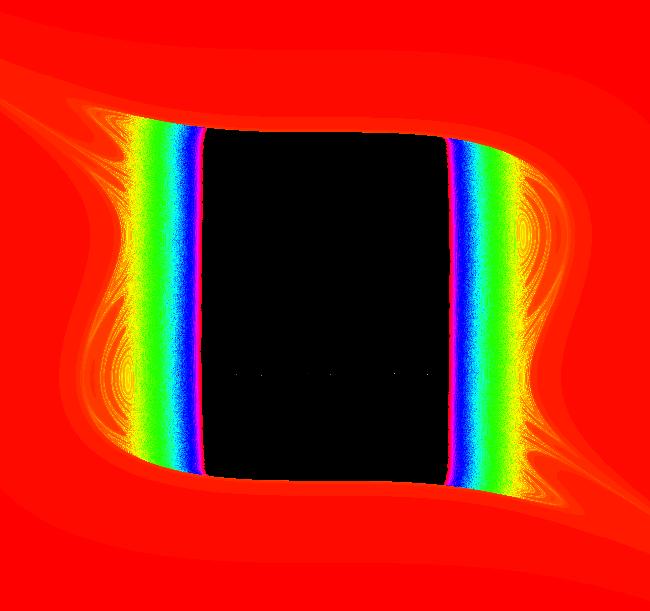
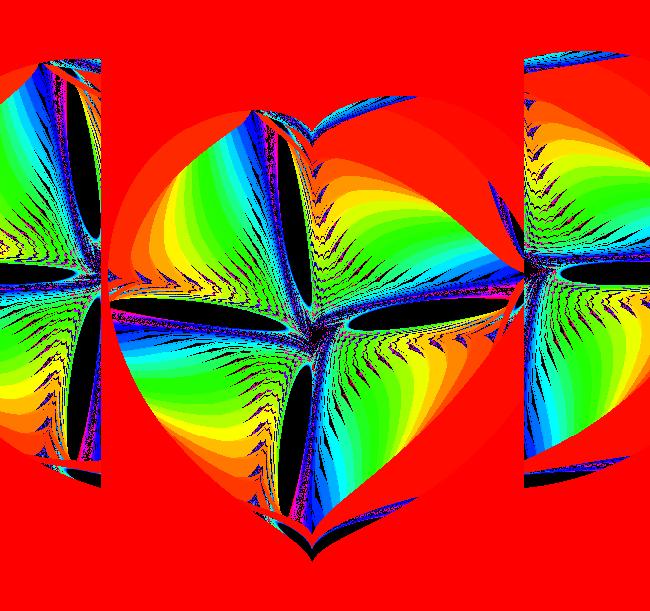
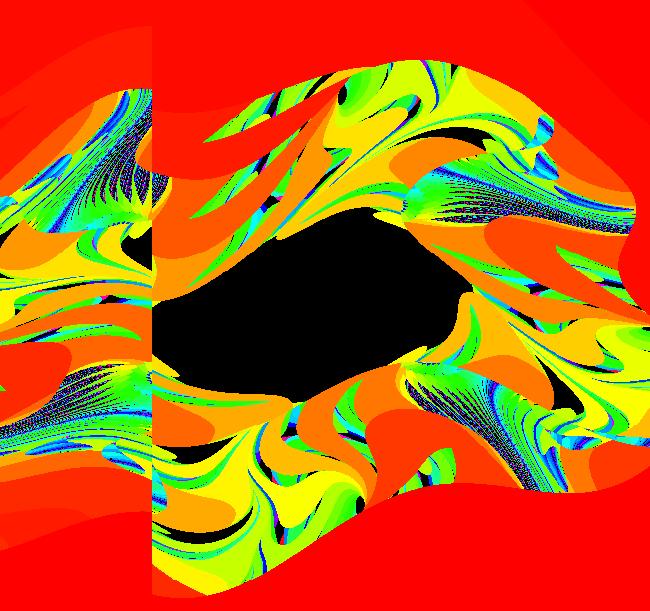
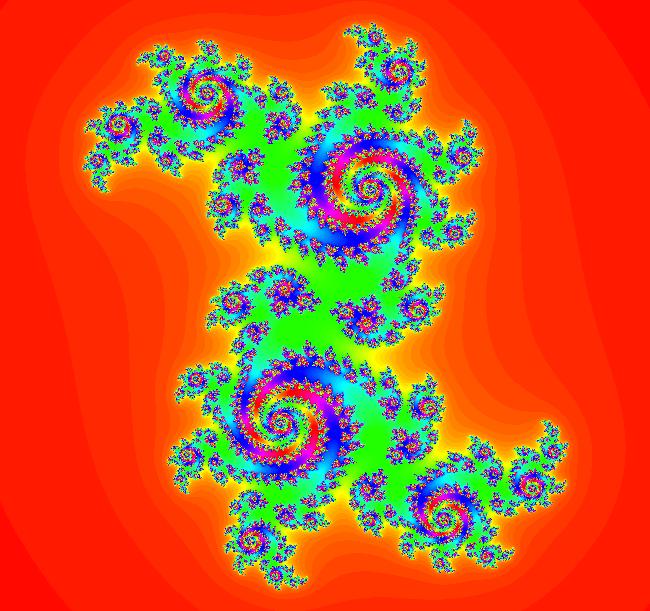
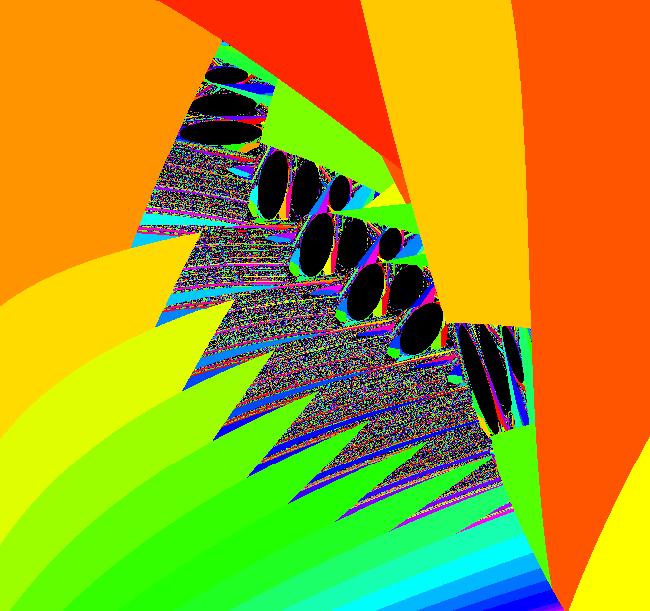
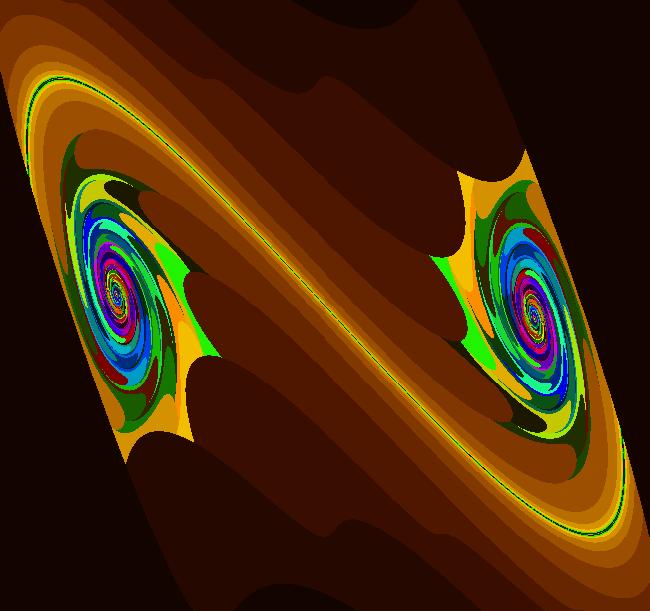
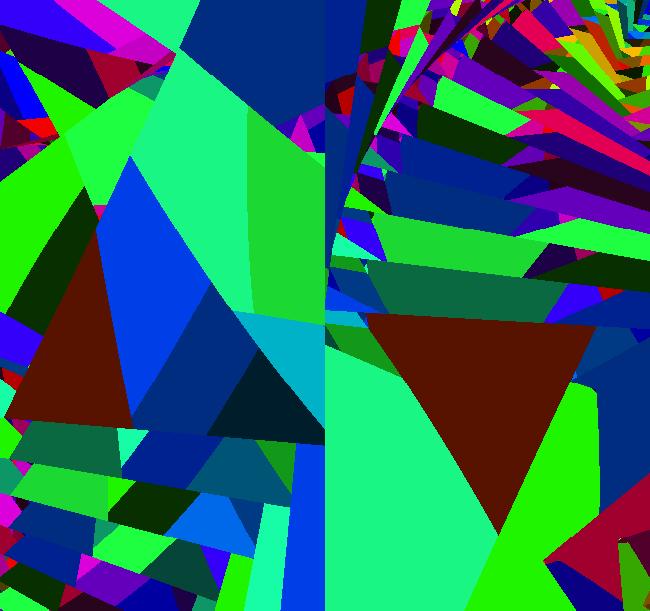
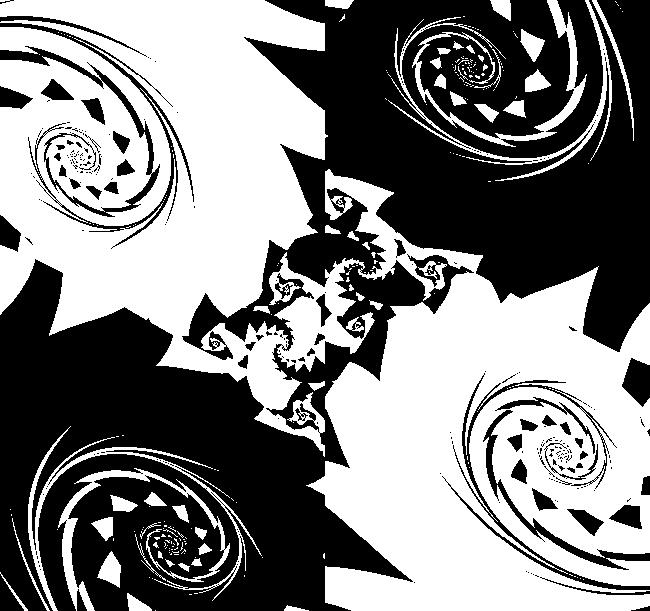
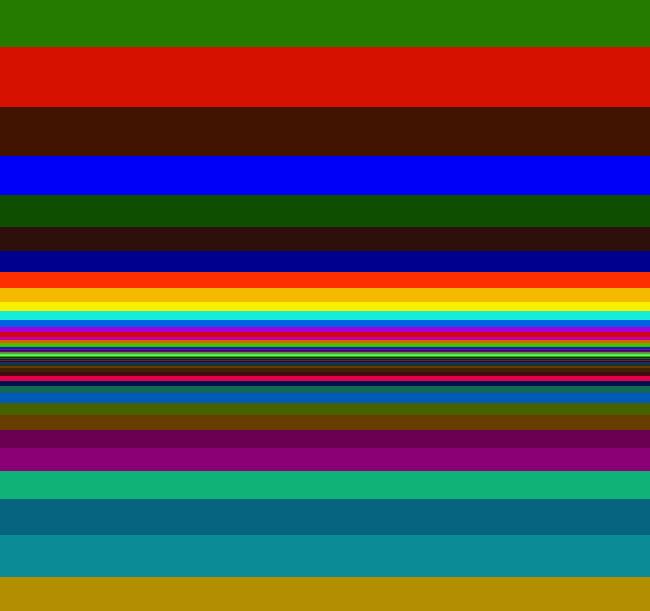
View/Sys/Gal: EMap "EMap 0 (x^2-y^2+p,2*x*y+q), p = .370, q = .310" in "ArtGallery." This is an example of a classic Mandelbrot fractal image. If you are not interested in the algorithm behind EMaps, skip to another system in the gallery. The iteration is defined by: x <- x^2-y^2+p, y <- 2*x*y+q. Parameters are: p = .370; q = .310; Zoom in to see the fractal nature of the image. To see the iteration carried out for a particular point, toggle to the IMap view (by clicking the Ode button and then the IMap button) and select "Show 2D IMap Orbit Sequence" on the Help menu. An orbit (blue) has been started at seed: (x,y) = (0.454,-0.864) and an orbit (red) has been started at seed: (X,y) = (-0.976852,0.484848). On the Help menu, select "Show 2D IMap Orbit Sequence" to better visualize the iteration steps in the orbit. The blue orbit spirals about a point near (0.167,0.465) more than 100 times and then at about the 369th step escapes from the viewing area. The red orbit escapes to infinity on about the 13-th step. The escape-time algorithm in OdeFactory uses a "bailout value" of 50 to terminate an iteration of more that 100 steps. Basically the EMap algorithm is: Define a color table of size 100. Then, for each point (pixel) in the viewing area: (1) iterate until: (a) the iteration step k becomes greater than 100 or (b) the k-th iterate leaves a circle, centered at the starting point, of radius sqrt(50). (2) If (a) terminated the iteration the point did not escape (within 100 steps) so color the point black but if (b) terminated the iteration (the point escaped within 100 steps), color the starting point color(k) where the escape time, k, is the k-th color in the color table. So - the point (0.454,-0.864) does not escape within 100 steps and it gets colored black in the EMap. Note that it ultimately does escape. The point (-0.976852,0.484848), escapes rather fast and is colored red in the EMap. So, the EMap images are defined by the following user specified inputs in OdeFactory - the vector field, - the parameter values and - the size of the viewing area but they are algorithmically constrained by - the bailout value, - the size of the color table and - the colors in the color table. Using a different bailout value, color table size and/or different colors in the color table would give a different, but similar, image. The color table is shown at the top of the EMap view. The left end (black) indicates no escape and the right end (red) indicates a fast escape.
|
|
|
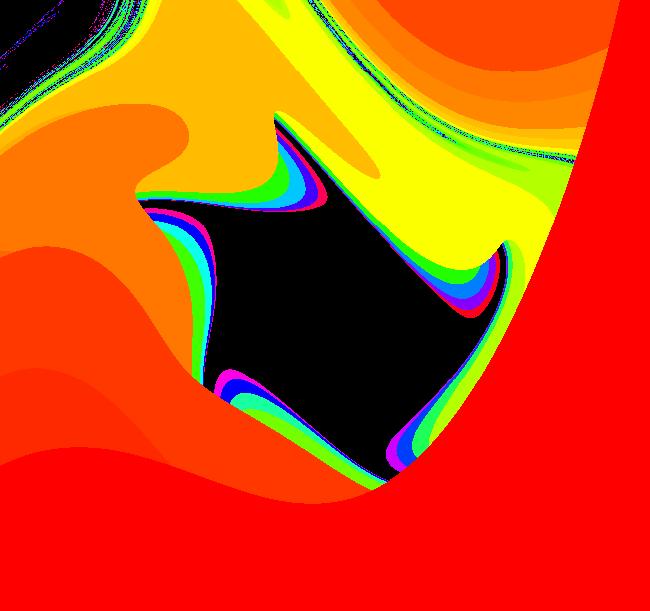
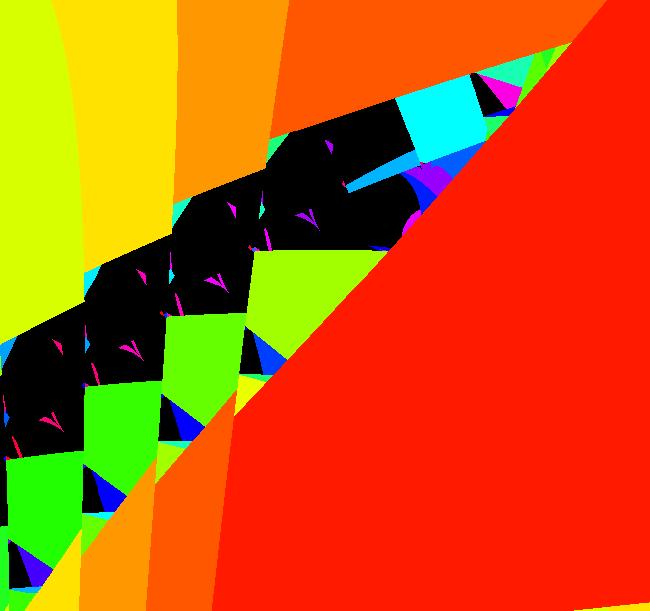
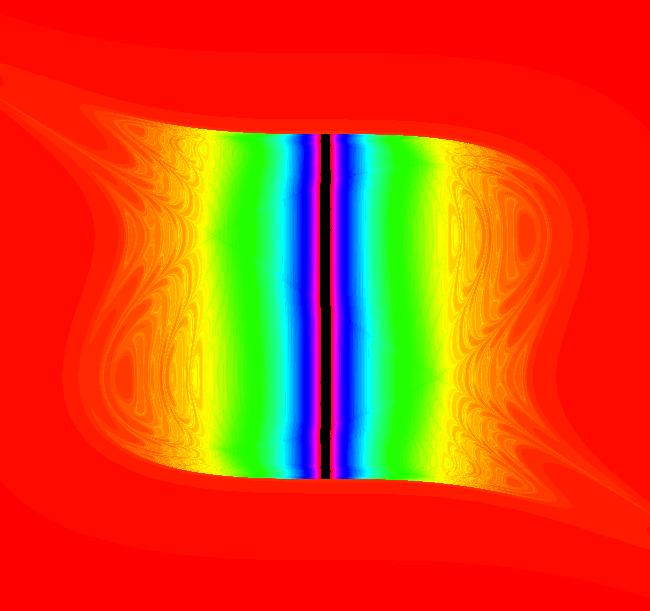
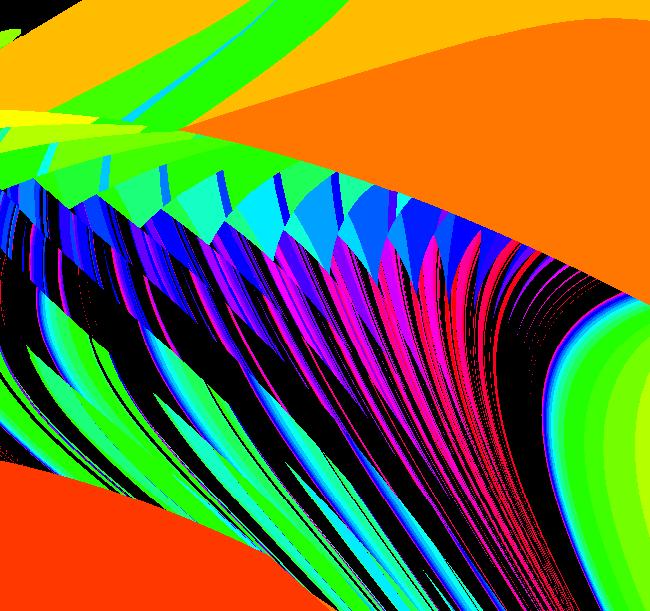
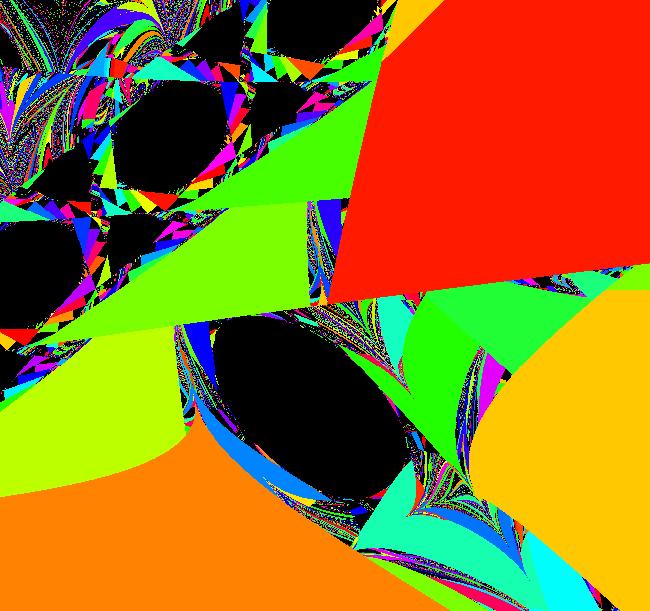
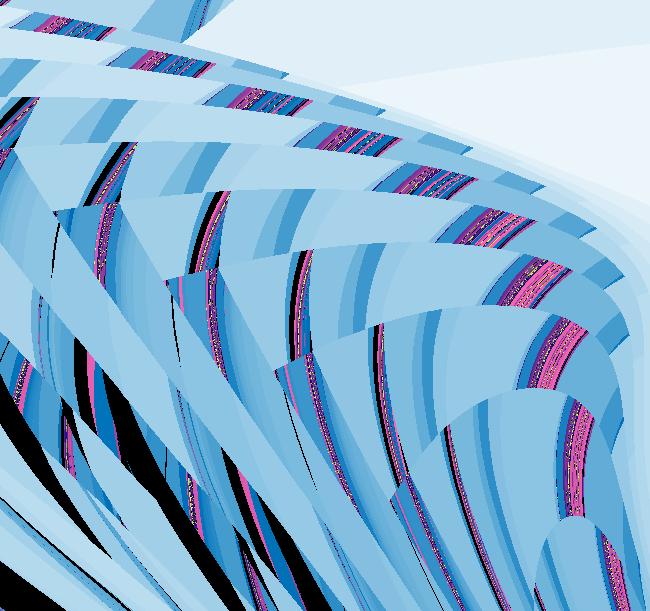
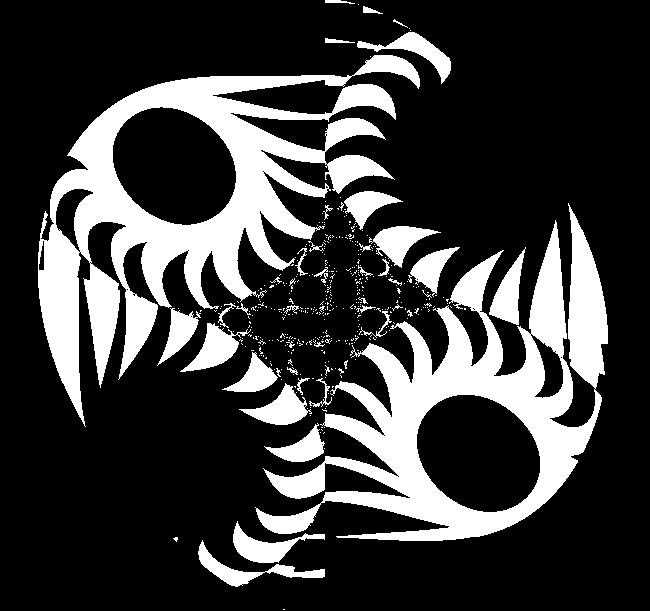
View/Sys/Gal: EMap "EMap 1 (y-cos(x), a-x)" in "ArtGallery." This iteration is defined by: x <- y-cos(x), y <- a-x. Parameters are: a = -2.20;
|
|
|
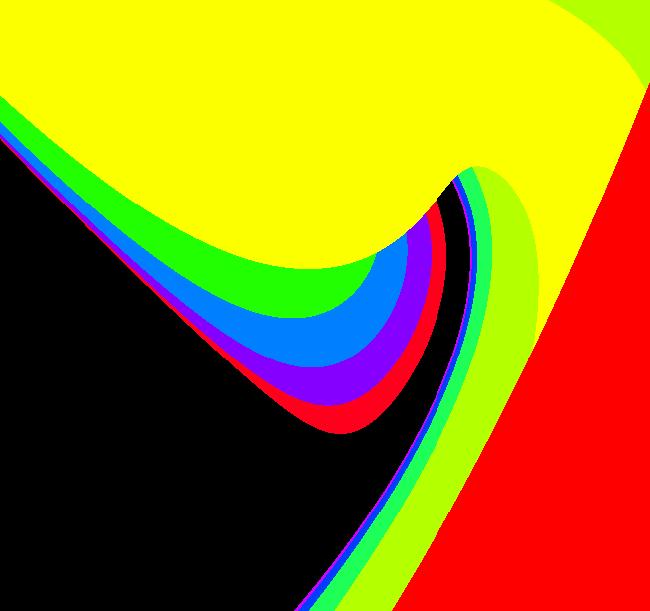
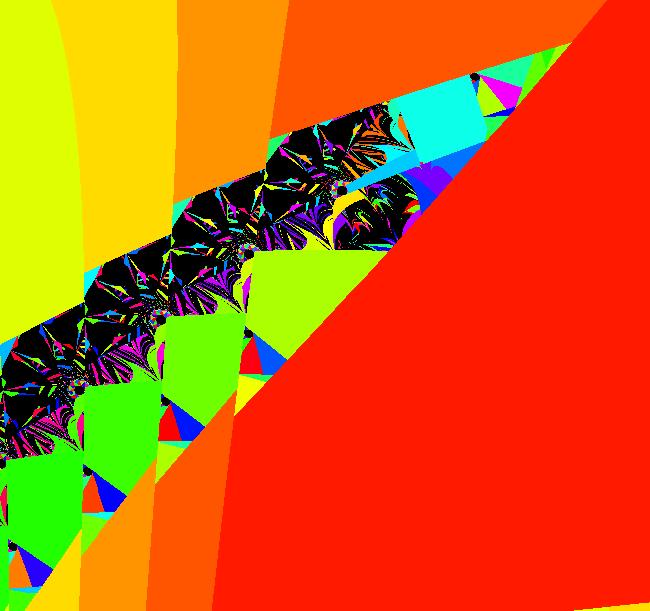
View/Sys/Gal: EMap "EMap 1.1" in "ArtGallery." This iteration is defined by: x <- y-cos(x), y <- a-x. Parameters are: a = -2.20; This is just part of the previous image.
|
|
|
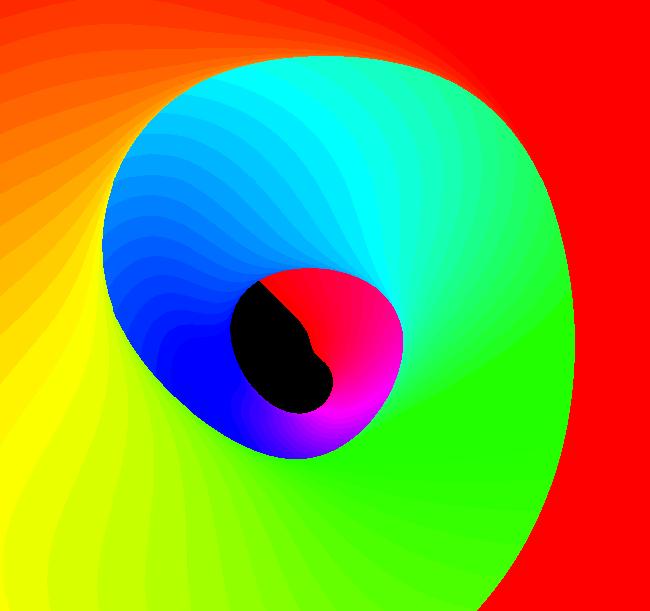
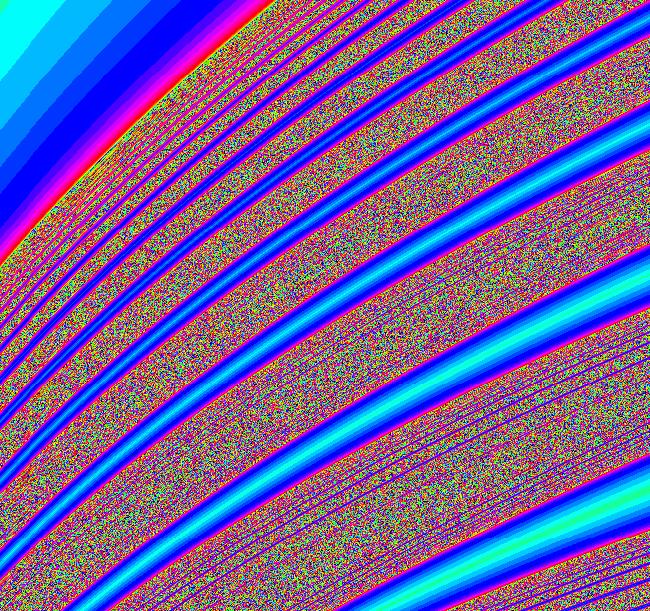
View/Sys/Gal: EMap "EMap 1.2" in "ArtGallery." This iteration is defined by: x <- x+h*(y-cos(x)), y <- y+h*(a-x). Parameters are: a = 2.900; h = .140; This is Euler's method applied to the system of odes: dx/dt = y-cos(x), dy/dt = a-x, in the EMap view.
|
|
|
View/Sys/Gal: EMap "EMap 2 (F,y+.7*F*(1-F^2/25)), F=x+.7*y" in "ArtGallery." This iteration is defined by: x <- F, y <- y+.7*F*(1-F^2/25). Functions are: F=x+.7*y
|
|
|
View/Sys/Gal: EMap "EMap 2.1" in "ArtGallery." This iteration is defined by: x <- (1+s*.01)*F, y <- (1+s*.01)*(y+.7*F*(1-F^2/25)). Parameters are: s = 2.70; Functions are: F=x+.7*y The time-scaling factor, (1+s*.01) = 1.027 is used to increase the speed of escape which decreases the size of the "prisoner set," that is, the size of the black regions.
|
|
|
View/Sys/Gal: EMap "EMap 3 (a*x^2-y, x-b)" in "ArtGallery." This iteration is defined by: x <- a*x^2-y, y <- x-b. Parameters are: a=1; b=0
|
|
|
View/Sys/Gal: EMap "EMap 3.1" in "ArtGallery." This iteration is defined by: x <- a*x^2-y, y <- x-b. Parameters are: a = 2.300; b = -.051;
|
|
|
View/Sys/Gal: EMap "EMap 4 (y-sgn(x)*cos(b*x-c), a-x)" in "ArtGallery." This iteration is defined by: x <- y-sgn(x)*cos(b*x-c), y <- a-x. Parameters are: a = .74; b = .50; c = .00; The function sgn(x) is just the sign of x.
|
|
|
View/Sys/Gal: EMap "EMap 4.1" in "ArtGallery." This iteration is defined by: x <- y-sgn(x)*cos(b*x-c), y <- a-x. Parameters are: a = .75; b = .47; c = .07;
|
|
|
View/Sys/Gal: EMap "EMap 4.2" in "ArtGallery." This iteration is defined by: x <- (1+s*.1)*(y-sgn(x)*cos(b*x-c)), y <- (1+s*.1)*(a-x). Parameters are: a = -.060; b = .500; c = -.053; s = .200; Systems 4.2 through 4.6 are time-scaled variations of systems 4.
|
|
|
View/Sys/Gal: EMap "EMap 4.3" in "ArtGallery." This iteration is defined by: x <- (1+s*.1)*(y-sgn(x)*cos(b*x-c)), y <- (1+s*.05)*(a-x). Parameters are: a = -.016; b = .310; c = .010; s = .270; Note the different x and y time scaling.
|
|
|
View/Sys/Gal: EMap "EMap 4.4" in "ArtGallery." This iteration is defined by: x <- (1+s*.1)*(y-sgn(x)*cos(b*x-c)), y <- (1+s*.05)*(a-x). Parameters are: a = -.060; b = .500; c = -.053; s = .200; Note the different x and y time scaling.
|
|
|
View/Sys/Gal: EMap "EMap 4.5" in "ArtGallery." This iteration is defined by: x <- (1+s*.05)*(y-sgn(x)*cos(b*x-c)), y <- (1+s*.05)*(a-x). Parameters are: a = -.060; b = .500; c = -.053; s = .400;
|
|
|
View/Sys/Gal: EMap "EMap 4.6" in "ArtGallery." This iteration is defined by: x <- (1+s*.05)*(y-sgn(x)*cos(b*x-c)), y <- (1+s*.05)*(a-x). Parameters are: a = -.016; b = .310; c = .010; s = .620;
|
|
|
View/Sys/Gal: EMap "EMap 5 (y-sgn(x)*sqrt(abs(b*x-c)), a-x)" in "ArtGallery." This iteration is defined by: x <- y-sgn(x)*sqrt(abs(b*x-c)), y <- a-x. Parameters are: a = .06; b = 1.00; c = -.76;
|
|
|
View/Sys/Gal: EMap "EMap 5.1" in "ArtGallery." This iteration is defined by: x <- y-sgn(x)*sqrt(abs(b*x-c)), y <- a-x. Parameters are: a = .06; b = 1.00; c = -.76; Shift-right-click in the graphics area to see the "shifted-quilt pattern" effect which is arrived at by playing with the bit-map.
|
|
|
View/Sys/Gal: EMap "EMap 5.2" in "ArtGallery." This iteration is defined by: x <- y-sgn(x)*sqrt(abs(b*x-c)), y <- a-x. Parameters are: a = 2.50; b = .50; c = 1.00;
|
|
|
View/Sys/Gal: EMap "EMap 6 (y-sqrt(abs(x)), a-x)" in "ArtGallery." This iteration is defined by: x <- y-sqrt(abs(x)), y <- a-x. Parameters are: a = 1.60;
|
|
|
View/Sys/Gal: EMap "EMap 7 (y-sgn(x)*sqrt(abs(b*x-c)), a-x%d)" in "ArtGallery." This iteration is defined by: x <- y-sgn(x)*sqrt(abs(b*x-c)), y <- a-x%d. Parameters are: a = 4.90; b = -.23; c = -.33; d = -83.00;
|
|
|
View/Sys/Gal: EMap "EMap 7.1" in "ArtGallery." This iteration is defined by: x <- y-sgn(x)*sqrt(abs(b*x-c)), y <- a-x%d. Parameters are: a = 4.90; b = -.23; c = -.33; d = -83.00;
|
|
|
View/Sys/Gal: IMap "EMap 7.2" in "ArtGallery." This iteration is defined by: x <- y-sgn(x)*sqrt(abs(b*x-c)), y <- a-x%d. Parameters are: a = 4.90; b = -.23; c = -.33; d = -83.00; In the IMap view, there is a period-19 orbit at: (x,y) = (3.473602,0.582307).
|
|
|
View/Sys/Gal: EMap "EMap 7.3" in "ArtGallery." This iteration is defined by: x <- y-sgn(x)*sqrt(abs(b*x-c)), y <- a-x%d. Parameters are: a = 4.90; b = -.12; c = -.33; d = -83.00; Try various color tables.
|
|
|
View/Sys/Gal: EMap "EMap 7.4" in "ArtGallery." This iteration is defined by: x <- y-sgn(x)*sqrt(abs(b*x-c)), y <- a-x%d. Parameters are: a = 4.90; b = -.12; c = -.33; d = -83.00;
|
|
|
View/Sys/Gal: EMap "EMap 7.5" in "ArtGallery." This iteration is defined by: x <- y-sgn(x)*sqrt(abs(b*x-c)), y <- a-x%d. Parameters are: a = 4.70; b = -.12; c = -.31; d = -81.00;
|
|
|
View/Sys/Gal: EMap "EMap 7.6" in "ArtGallery." This iteration is defined by: x <- y-sgn(x)*sqrt(abs(b*x-c)), y <- a-x. Parameters are: a = 4.300; b = .710; c = 1.300;
|
|
|
View/Sys/Gal: EMap "EMap 7.7" in "ArtGallery." This iteration is defined by: x <- y-sgn(x)*sqrt(abs(b*x-c)), y <- a-x. Parameters are: a = 4.300; b = .710; c = 1.300;
|
|
|
View/Sys/Gal: EMap "EMap 8 ((1-a*y^2), -(b*x^2+c)" in "ArtGallery." This iteration is defined by: x <- (1-a*y^2), y <- -(b*x^2+c). Parameters are: a = .57; b = 2.80; c = -.59; This is a fractal. Try zooming in.
|
|
|
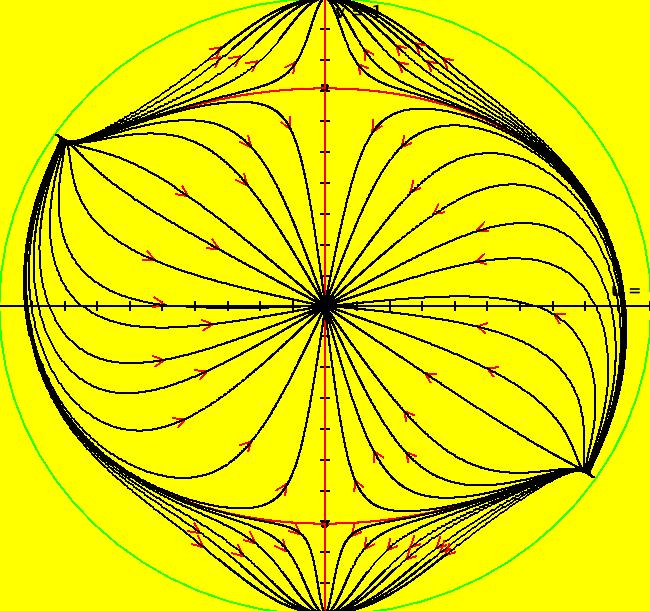
View/Sys/Gal: Ode "EMap 9 (-x*(1-a*y^2), b*x^3+y^3-y)" in "ArtGallery." This iteration is defined by: x <- -x*(1-a*y^2), y <- b*x^3+y^3-y. Parameters are: a = -.01; b = .31; This system is interesting in the Ode, IMap and EMap views. Note that the finite fixed points, (0,0) and (0,+-1), are independent of both parameters a and b but one pair of fixed points at infinity depend on b. Also try the Ode/R2+ view and IMap/R2 views. Adjust the parameters in the various views. Try various color tables.
|
|
|
View/Sys/Gal: EMap "EMap 9.1" in "ArtGallery." This iteration is defined by: x <- (1+s*.1)*(-x*(1-a*y^2)), y <- (1+s*.1)*(b*x^3+y^3-y). Parameters are: a = -.010; b = .310; s = .420; This is a time-scaled version of "EMap 9."
|
|
|
View/Sys/Gal: EMap "EMap 10 (y-cos(x%b), a-x)" in "ArtGallery." This iteration is defined by: x <- y-cos(x%b), y <- a-x. Parameters are: a = 1.100; b = 2.300; The "%" operator is the Java mod function. See IMap 7.
|
|
|
View/Sys/Gal: EMap "EMap 10.1" in "ArtGallery." This iteration is defined by: x <- y-cos(x%b), y <- a-x. Parameters are: a = 1.100; b = 2.300; Part of EMap 10.
|
|
|
View/Sys/Gal: EMap "EMap 10.2" in "ArtGallery." This iteration is defined by: x <- y-cos(x%b), y <- a-x. Parameters are: a = 1.100; b = 2.300; Part of EMap 10.
|
|
|
View/Sys/Gal: EMap "EMap 10.3" in "ArtGallery." This iteration is defined by: x <- y-cos(x%b), y <- a-x. Parameters are: a = 1.100; b = 2.300; Part of EMap 10.
|
|
|
View/Sys/Gal: EMap "EMap 10.4" in "ArtGallery." This iteration is defined by: x <- y-cos(x%b), y <- a-x. Parameters are: a = 1.100; b = 2.300; Part of EMap 10.
|
|
|
View/Sys/Gal: EMap "EMap 11 (y-sqrt(abs(x%c)), a-x%b)" in "ArtGallery." This iteration is defined by: x <- y-sqrt(abs(x%c)), y <- a-x%b. Parameters are: a = .40; b = -8.20; c = 3.10; Zoom out to see the rest of the EMap.
|
|
|
View/Sys/Gal: EMap "EMap 11.1" in "ArtGallery." This iteration is defined by: x <- y-sqrt(abs(x%c)), y <- a-x%b. Parameters are: a = .41; b = -6.70; c = -2.90;
|
|
|
View/Sys/Gal: EMap "EMap 11.2" in "ArtGallery." This iteration is defined by: x <- y-sqrt(abs(x%c)), y <- a-x%b. Parameters are: a = .40; b = -8.20; c = 3.10;
|
|
|
View/Sys/Gal: EMap "EMap 11.3" in "ArtGallery." This iteration is defined by: x <- y-sqrt(abs(x%c)), y <- a-x%b. Parameters are: a = .40; b = -8.20; c = 3.40;
|
|
|
View/Sys/Gal: EMap "EMap 11.4" in "ArtGallery." This iteration is defined by: x <- y-sqrt(abs(x%c)), y <- a-x%b. Parameters are: a = .40; b = -8.40; c = 3.40;
|
|
|
View/Sys/Gal: EMap "EMap 11.5" in "ArtGallery." This iteration is defined by: x <- y-sqrt(abs(x%c)), y <- a-x%b. Parameters are: a = .40; b = -8.40; c = 5.10;
|
|
|
View/Sys/Gal: EMap "EMap 11.6" in "ArtGallery." This iteration is defined by: x <- y-sqrt(abs(x%c)), y <- a-x%b. Parameters are: a = .400; b = -7.200; c = 3.100;
|
|
|
View/Sys/Gal: EMap "EMap 12 (y-sqrt(abs(x)), a-x%b)" in "ArtGallery." This iteration is defined by: x <- y-sqrt(abs(x)), y <- a-x%b. Parameters are: a = .70; b = 6.50;
|
|
|
View/Sys/Gal: EMap "EMap 12.1" in "ArtGallery." This iteration is defined by: x <- y-sqrt(abs(x)), y <- a-x%b. Parameters are: a = .79; b = -6.70; Zoom out to see the rest of the EMap.
|
|
|
View/Sys/Gal: EMap "EMap 13 (y-sgn(x)*sqrt(abs(b%x-c)),a-x*d)" in "ArtGallery." This iteration is defined by: x <- y-sgn(x)*sqrt(abs(b%x-c)), y <- a-x*d. Parameters are: a = -.47; b = -4.70; c = 9.40; d = 1.10;
|
|
|
View/Sys/Gal: EMap "EMap 13.1" in "ArtGallery." This iteration is defined by: x <- y-sgn(x)*sqrt(abs(b%x-c)), y <- a-x*d. Parameters are: a = -.47; b = -4.70; c = 9.40; d = 1.10;
|
|
|
View/Sys/Gal: EMap "EMap 13.2" in "ArtGallery." This iteration is defined by: x <- y-sgn(x)*sqrt(abs(b%x-c)), y <- a-x*d. Parameters are: a = -.44; b = -4.70; c = 9.40; d = 1.10; Try some other color tables.
|
|
|
View/Sys/Gal: EMap "EMap 13.3" in "ArtGallery." This iteration is defined by: x <- y-sgn(x)*sqrt(abs(b%x-c)), y <- a-x*d. Parameters are: a = -.43; b = -4.70; c = 9.40; d = 1.10;
|
|
|
View/Sys/Gal: EMap "EMap 14 ((1+s*.1)*(y-cos(x%b)),(1+s*.1)*(a-x))" in "ArtGallery." This iteration is defined by: x <- (1+s*.1)*(y-cos(x%b)), y <- (1+s*.1)*(a-x). Parameters are: a = -2.800; b = 3.500; s = -.100;
|
|
|
View/Sys/Gal: EMap "EMap 14.1" in "ArtGallery." This iteration is defined by: x <- (1+s*.1)*(y-cos(x%b)), y <- (1+s*.1)*(a-x). Parameters are: a = -2.800; b = 3.600; s = -.100; From EMap 14.
|
|
|
View/Sys/Gal: EMap "EMap 14.2" in "ArtGallery." This iteration is defined by: x <- (1+s*.1)*(y-cos(x%b)), y <- (1+s*.1)*(a-x). Parameters are: a = -2.600; b = 3.500; s = -.110; From EMap 14.1. |
|
|
View/Sys/Gal: EMap "EMap 14.3" in "ArtGallery." This iteration is defined by: x <- (1+s*.1)*(y-cos(x%b)), y <- (1+s*.1)*(a-x). Parameters are: a = -2.700; b = 3.600; s = .100; From EMap 14.
|
|
|
View/Sys/Gal: EMap "EMap 14.4" in "ArtGallery." This iteration is defined by: x <- (1+s*.1)*(y-cos(x%b)), y <- (1+s*.1)*(a-x). Parameters are: a = -2.800; b = 3.500; s = -.100; From EMap 14.
|
|
|
View/Sys/Gal: EMap "EMap 14.5" in "ArtGallery." This iteration is defined by: x <- (1+s*.1)*(y-cos(x%b)), y <- (1+s*.1)*(a-x). Parameters are: a = -2.800; b = 3.600; s = .000; From EMap 14. |
|
|
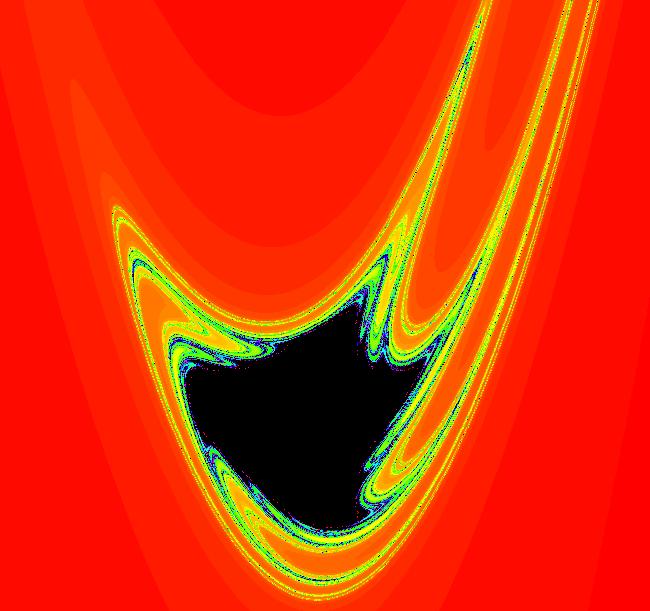
View/Sys/Gal: EMap "EMap 15 (y,-(1+b*.01)*x+y%a-y^3)" in "ArtGallery." This iteration is defined by: x <- y, y <- -(1+b*.01)*x+y%a-y^3. Parameters are: a = -.260; b = 6.200;
|
|
|
View/Sys/Gal: EMap "EMap 15.1" in "ArtGallery." This iteration is defined by: x <- y, y <- -(1+b*.01)*x+y%a-y^3. Parameters are: a = -.260; b = 6.200;
|
|
|
View/Sys/Gal: EMap "EMap 15.2" in "ArtGallery." This iteration is defined by: x <- y, y <- -(1+b*.01)*x+y%a-y^3. Parameters are: a = -.320; b = 1.900;
|
|
|
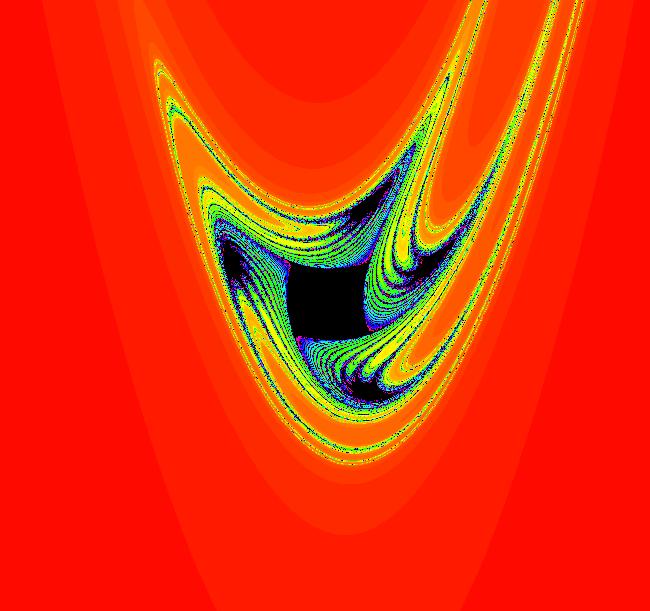
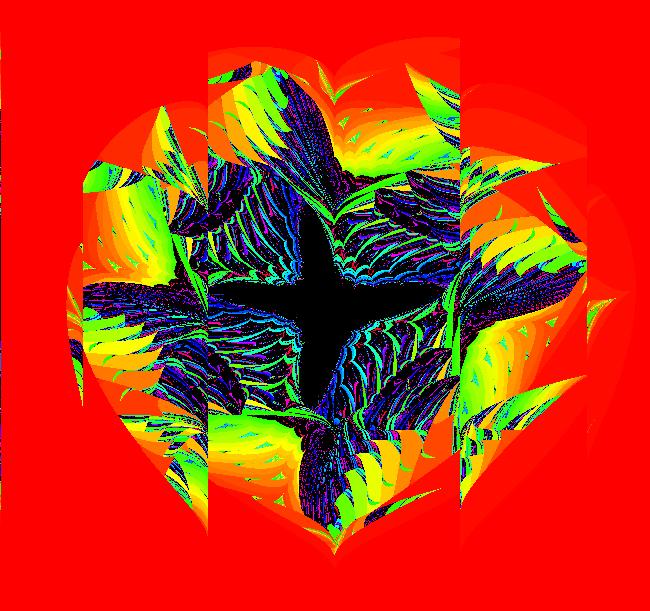
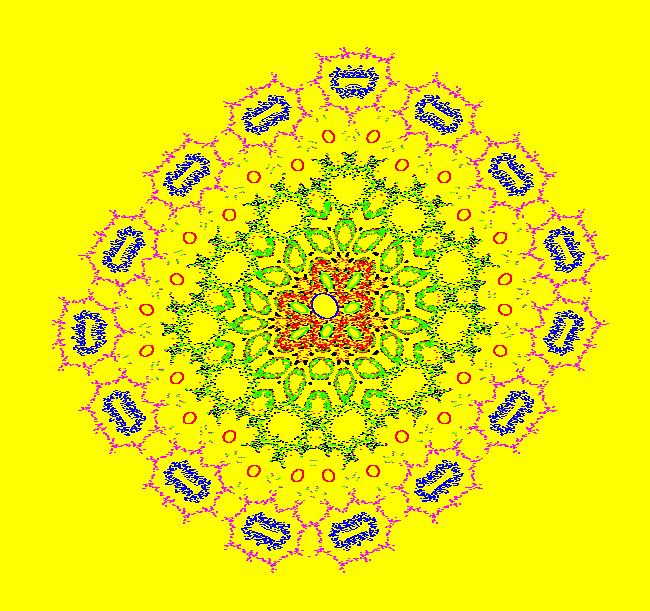
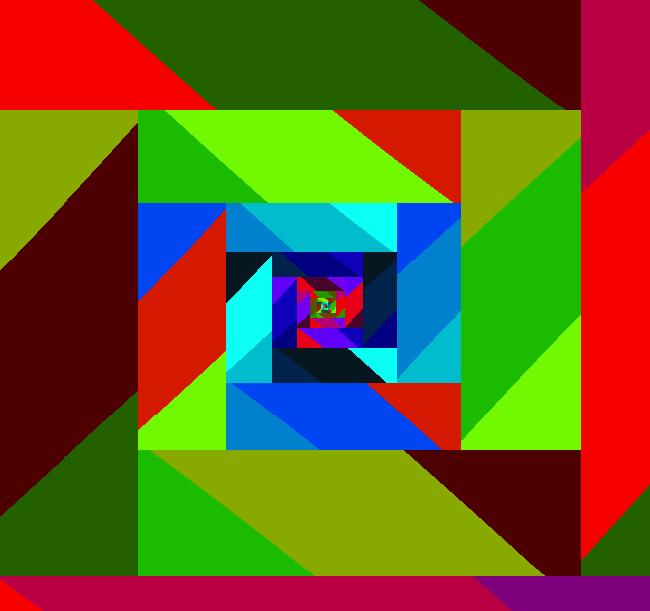
View/Sys/Gal: EMap "EMap 15.3 Blue Fox for Pablo" in "ArtGallery." This iteration is defined by: x <- y, y <- -(1+b*.01)*x+y%a-y^3. Parameters are: a = -.320; b = 1.900; Can you see the fox head in the center of the image?
|
|
|
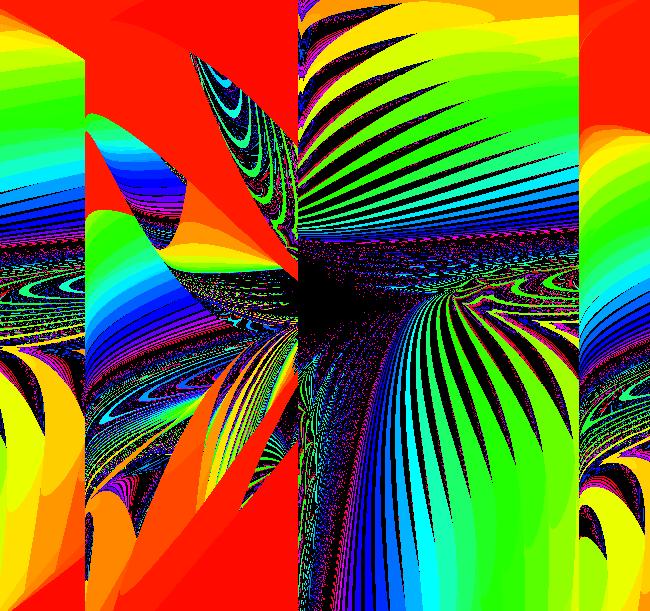
View/Sys/Gal: EMap "EMapCT1 Strange Moon Rising" in "ArtGallery." This iteration is defined by: x <- y-cos(cos(cos(cos(x)))), y <- a-x. Parameters are: a = 5.700; EMap CT: 1 Try various color tables. Fun with function composition: try cos(x) then cos(cos(x)) ..., mix cos and sin, try cosh and sinh.
|
|
|
View/Sys/Gal: EMap "EMapCT2 14b" in "ArtGallery." This iteration is defined by: x <- (1+s*.1)*(y-cos(x%b)), y <- (1+s*.1)*(a-x). Parameters are: a = -2.800; b = 3.500; s = .570; EMap CT: 2
|
|
|
View/Sys/Gal: EMap "EMapCT3 12b" in "ArtGallery." This iteration is defined by: x <- y-sqrt(abs(x)), y <- a-x%b. Parameters are: a = .70; b = 6.50; EMap CT: 3
|
|
|
View/Sys/Gal: EMap "EMapCT3 14.2b" in "ArtGallery." This iteration is defined by: x <- (1+s*.1)*(y-cos(x%b)), y <- (1+s*.1)*(a-x). Parameters are: a = -2.600; b = 3.500; s = -.110; EMap CT: 3
|
|
|
View/Sys/Gal: EMap "EMapCT3 4.3b" in "ArtGallery." This iteration is defined by: x <- (1+s*.1)*(y-sgn(x)*cos(b*x-c)), y <- (1+s*.05)*(a-x). Parameters are: a = -.016; b = .310; c = .010; s = .270; EMap CT: 3
|
|
|
View/Sys/Gal: EMap "EMapCT3 4.6b" in "ArtGallery." This iteration is defined by: x <- (1+s*.05)*(y-sgn(x)*cos(b*x-c)), y <- (1+s*.05)*(a-x). Parameters are: a = -.016; b = .310; c = .010; s = .620; EMap CT: 3
|
|
|
View/Sys/Gal: EMap "EMapCT3 7.7b" in "ArtGallery." This iteration is defined by: x <- y-sgn(x)*sqrt(abs(b*x-c)), y <- a-x. Parameters are: a = 4.300; b = .710; c = 1.300; EMap CT: 3
|
|
|
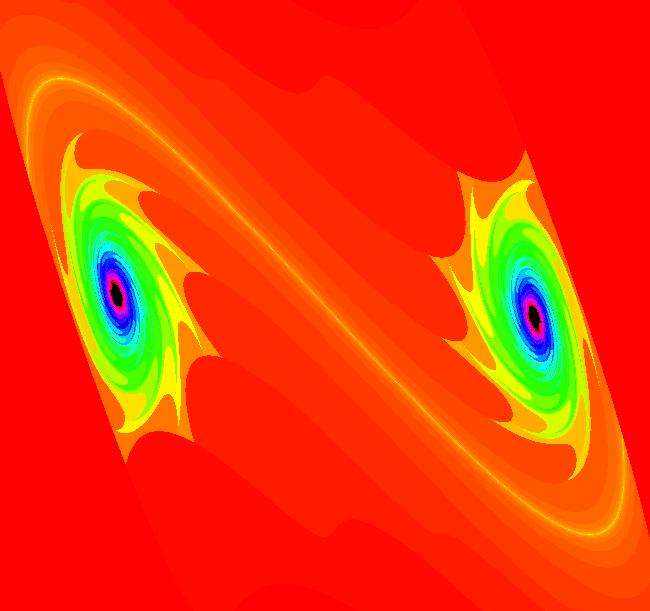
View/Sys/Gal: EMap "EMapMaxCT1 0" in "ArtGallery." This iteration is defined by: x <- x^2-y^2+p, y <- 2*x*y+q. Parameters are: p = .370; q = .310; EMap CT: 1
|
|
|
View/Sys/Gal: EMap "EMapMaxCT1 1.2" in "ArtGallery." This iteration is defined by: x <- x+h*(y-cos(x)), y <- y+h*(a-x). Parameters are: a = 2.900; h = .140; EMap CT: 1
|
|
|
View/Sys/Gal: EMap "EMapMaxCT1 7.1" in "ArtGallery." This iteration is defined by: x <- y-sgn(x)*sqrt(abs(b*x-c)), y <- a-x%d. Parameters are: a = 4.90; b = -.23; c = -.33; d = -83.00; EMap CT: 1
|
|
|
View/Sys/Gal: EMap "EMapMaxCT1 7.3" in "ArtGallery." This iteration is defined by: x <- y-sgn(x)*sqrt(abs(b*x-c)), y <- a-x%d. Parameters are: a = 4.90; b = -.12; c = -.33; d = -83.00; EMap CT: 1
|
|
|
View/Sys/Gal: EMap "EMapMaxCT1 7.6" in "ArtGallery." This iteration is defined by: x <- y-sgn(x)*sqrt(abs(b*x-c)), y <- a-x. Parameters are: a = 4.300; b = .710; c = 1.300; EMap CT: 1
|
|
|
View/Sys/Gal: EMap "EMapMaxCT1 7.7" in "ArtGallery." This iteration is defined by: x <- y-sgn(x)*sqrt(abs(b*x-c)), y <- a-x. Parameters are: a = 4.300; b = .710; c = 1.300; EMap CT: 1
|
|
|
View/Sys/Gal: EMap "EMapMaxCT2 4.6" in "ArtGallery." This iteration is defined by: x <- (1+s*.05)*(y-sgn(x)*cos(b*x-c)), y <- (1+s*.05)*(a-x). Parameters are: a = -.016; b = .310; c = .010; s = .620; EMap CT: 2
|
|
|
View/Sys/Gal: EMap "EMapMaxCT2 7.3" in "ArtGallery." This iteration is defined by: x <- y-sgn(x)*sqrt(abs(b*x-c)), y <- a-x%d. Parameters are: a = 4.90; b = -.12; c = -.33; d = -83.00; EMap CT: 2
|
|
|
View/Sys/Gal: EMap "EMapMaxCT2 12b" in "ArtGallery." This iteration is defined by: x <- y-sqrt(abs(x)), y <- a-x%b. Parameters are: a = .70; b = 6.50; EMap CT: 2
|
|
|
View/Sys/Gal: EMap "EMapMaxCT2 13.1" in "ArtGallery." This iteration is defined by: x <- y-sgn(x)*sqrt(abs(b%x-c)), y <- a-x*d. Parameters are: a = -.47; b = -4.70; c = 9.40; d = 1.10; EMap CT: 2
|
|
|
View/Sys/Gal: EMap "EMapMaxCT2 13.3" in "ArtGallery." This iteration is defined by: x <- y-sgn(x)*sqrt(abs(b%x-c)), y <- a-x*d. Parameters are: a = -.44; b = -4.70; c = 9.40; d = 1.10; EMap CT: 2
|
|
|
View/Sys/Gal: EMap "EMapMaxCT2 15" in "ArtGallery." This iteration is defined by: x <- y, y <- -(1+b*.01)*x+y%a-y^3. Parameters are: a = -.260; b = 6.200; EMap CT: 2
|
|
|
View/Sys/Gal: EMap "EMapMaxCT2 15.1" in "ArtGallery." This iteration is defined by: x <- y, y <- -(1+b*.01)*x+y%a-y^3. Parameters are: a = -.260; b = 6.200; EMap CT: 2
|
|
|
View/Sys/Gal: EMap "EMapMaxCT3 6" in "ArtGallery." This iteration is defined by: x <- y-sqrt(abs(x)), y <- a-x. Parameters are: a = 1.60; EMap CT: 3
|
|
|
View/Sys/Gal: EMap "EMapMaxCT3 7.3" in "ArtGallery." This iteration is defined by: x <- y-sgn(x)*sqrt(abs(b*x-c)), y <- a-x%d. Parameters are: a = 4.90; b = -.12; c = -.33; d = -83.00; EMap CT: 3
|
|
|
View/Sys/Gal: EMap "EMapMaxCT3 7.5" in "ArtGallery." This iteration is defined by: x <- y-sgn(x)*sqrt(abs(b*x-c)), y <- a-x%d. Parameters are: a = 4.70; b = -.12; c = -.31; d = -81.00; EMap CT: 3
|
|
|
View/Sys/Gal: EMap "EMapMaxCT3 14.1" in "ArtGallery." This iteration is defined by: x <- (1+s*.1)*(y-cos(x%b)), y <- (1+s*.1)*(a-x). Parameters are: a = -2.800; b = 3.600; s = -.100; EMap CT: 3
|
|
|
View/Sys/Gal: EMap "EMapMaxCT3 14.2b" in "ArtGallery." This iteration is defined by: x <- (1+s*.1)*(y-cos(x%b)), y <- (1+s*.1)*(a-x). Parameters are: a = -2.600; b = 3.500; s = -.110; EMap CT: 3
|
|
|
View/Sys/Gal: EMap "EMapMaxCT5 2.1" in "ArtGallery." This iteration is defined by: x <- (1+s*.01)*F, y <- (1+s*.01)*(y+.7*F*(1-F^2/25)). Parameters are: s = 2.70; Functions are: F=x+.7*y EMap CT: 5
|
|
|
View/Sys/Gal: EMap "EMapMaxCT5 4.3" in "ArtGallery." This iteration is defined by: x <- (1+s*.1)*(y-sgn(x)*cos(b*x-c)), y <- (1+s*.05)*(a-x). Parameters are: a = -.016; b = .310; c = .010; s = .270;
EMap CT: 5
|
|
|
View/Sys/Gal: EMap "EMapMaxCT5 4.3b" in "ArtGallery." This iteration is defined by: x <- (1+s*.1)*(y-sgn(x)*cos(b*x-c)), y <- (1+s*.05)*(a-x). Parameters are: a = -.016; b = .310; c = .010; s = .270; EMap CT: 5 Also try CTs: 1, 2, 6 and 9.
|
|
|
View/Sys/Gal: EMap "EMapMaxCT5 4.6b" in "ArtGallery." This iteration is defined by: x <- (1+s*.05)*(y-sgn(x)*cos(b*x-c)), y <- (1+s*.05)*(a-x). Parameters are: a = -.1000; b = .3100; c = .0100; s = .6200; EMap CT: 5
|
|
|
View/Sys/Gal: EMap "EMapMaxCT5 5" in "ArtGallery." This iteration is defined by: x <- y-sgn(x)*sqrt(abs(b*x-c)), y <- a-x. Parameters are: a = .06; b = 1.00; c = -.76; EMap CT: 5
|
|
|
View/Sys/Gal: EMap "EMapMaxCT5 5.2" in "ArtGallery." This iteration is defined by: x <- y-sgn(x)*sqrt(abs(b*x-c)), y <- a-x. Parameters are: a = 2.50; b = .50; c = 1.00; EMap CT: 5
|
|
|
View/Sys/Gal: EMap "EMapMaxCT5 14.3" in "ArtGallery." This iteration is defined by: x <- (1+s*.1)*(y-cos(x%b)), y <- (1+s*.1)*(a-x). Parameters are: a = -2.700; b = 3.600; s = .100; EMap CT: 5
|
|
|
View/Sys/Gal: EMap "EMapMaxCT5 14.5" in "ArtGallery." This iteration is defined by: x <- (1+s*.1)*(y-cos(x%b)), y <- (1+s*.1)*(a-x). Parameters are: a = -3.4000; b = 3.4000; s = .0850; EMap CT: 5
|
|
|
View/Sys/Gal: EMap "EMapMaxCT5 14b" in "ArtGallery." This iteration is defined by: x <- (1+s*.1)*(y-cos(x%b)), y <- (1+s*.1)*(a-x). Parameters are: a = -2.800; b = 3.500; s = .570; EMap CT: 5
|
|
|
View/Sys/Gal: EMap "EMapMaxCT6 4.4" in "ArtGallery." This iteration is defined by: x <- (1+s*.1)*(y-sgn(x)*cos(b*x-c)), y <- (1+s*.05)*(a-x). Parameters are: a = -.060; b = .500; c = -.053; s = .200; EMap CT: 6 Try zooming in.
|
|
|
View/Sys/Gal: EMap "EMapMaxCT6 13.4" in "ArtGallery." This iteration is defined by: x <- y-sgn(x)*sqrt(abs(b%x-c)), y <- a-x*d. Parameters are: a = -.43; b = -4.70; c = 9.40; d = 1.10; EMap CT: 6
|
|
|
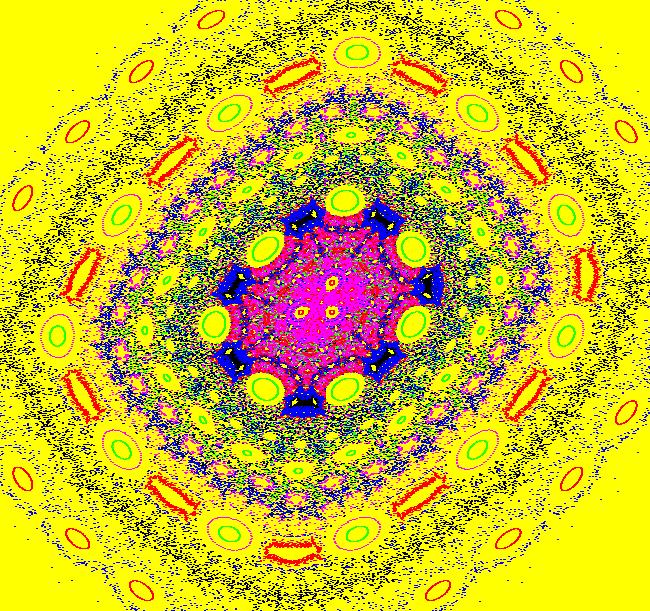
View/Sys/Gal: IMap "IMap0011 1" in "ArtGallery." Allow time for the image to be draw. This iteration is defined by: x <- y-cos(x), y <- a-x. Parameters are: a = -2.30; While the image is being generated, you will see the busy cursor in the graphics area. When the image has been completed the cursor will revert to the arrow cursor. Zoom in several times to see the small scale structure. Toggle "Show 2D IMap Orbit Sequence" on the Help menu. Toggle "Hide Axes" on the Help menu. Toggle "Hide Arrowheads/Seeds" on the Help menu. To create your own version of the IMap, while in the IMap view, clear the orbits (the seed points) using the "Clear" button, then click in the viewing area to start new orbits. To color the orbits, click the "Center" button to force a redraw.
|
|
|
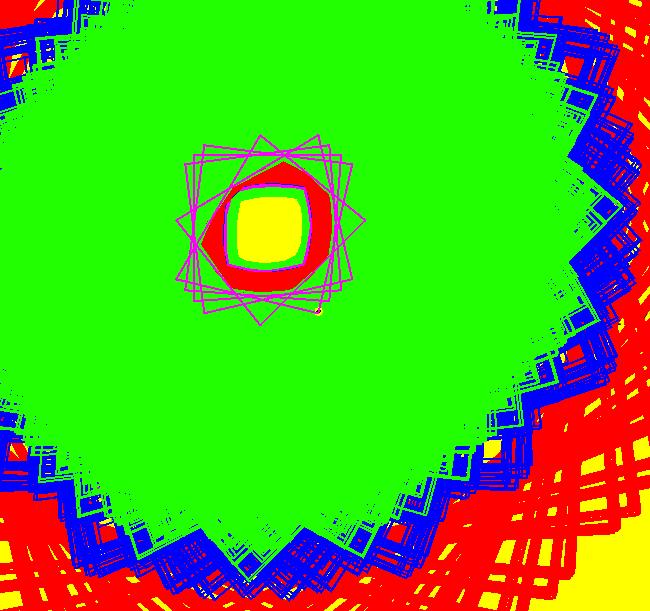
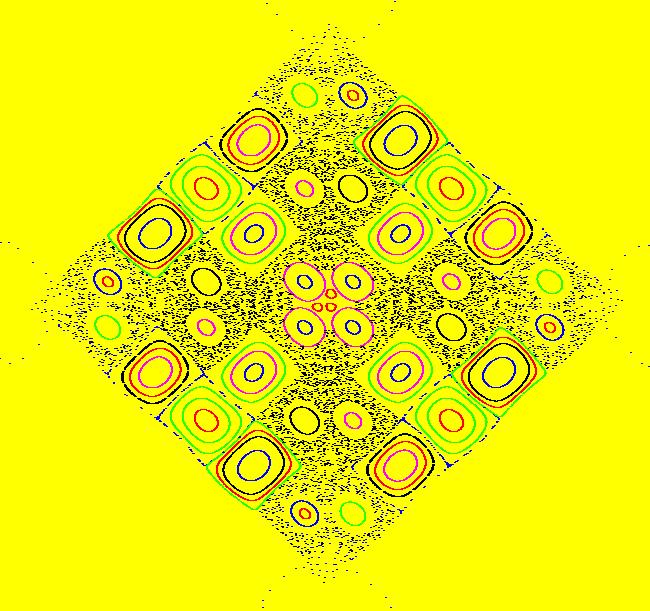
View/Sys/Gal: IMap "IMap0011 2" in "ArtGallery." This iteration is defined by: x <- a*x^2-y, y <- x-b. Parameters are: a = .60; b = .00; Toggle "Show 2D IMap Orbit Sequence" on the Help menu. The orbits are periodic with large periods. The red orbit in the center of the image has period 4. Turn on "Show Approximate IMap Orbit Period" on the Help menu to calculate the period.
|
|
|
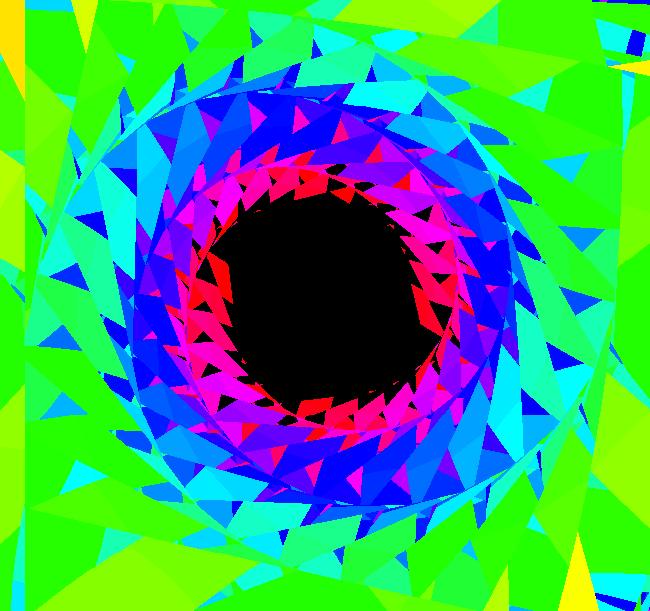
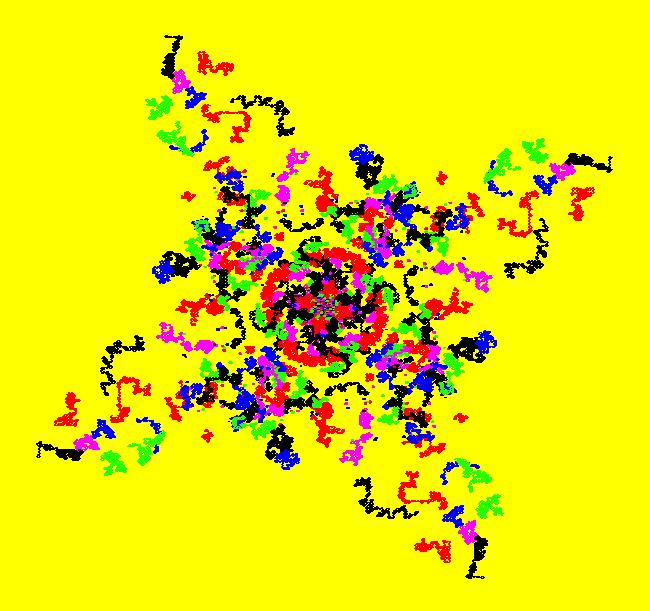
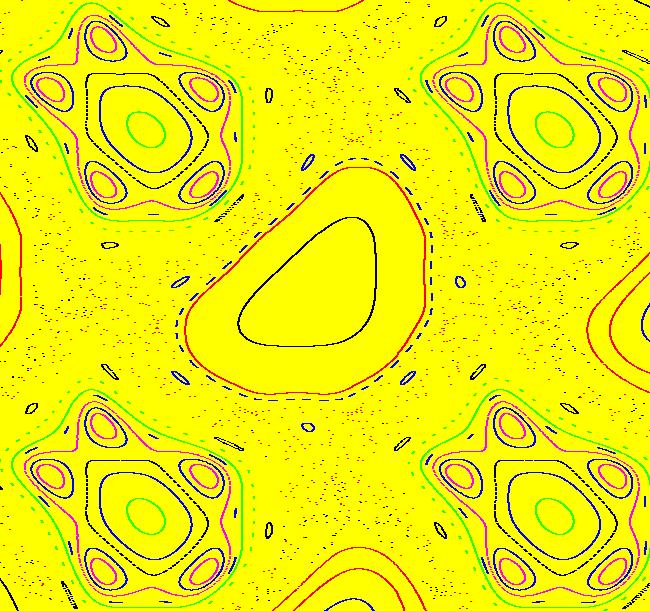
View/Sys/Gal: IMap "IMap0011 3" in "ArtGallery." This iteration is defined by: x <- y-sgn(x)*cos(b*x-c), y <- a-x. Parameters are: a = .72; b = .52; c = .00; Toggle "Show 2D IMap Orbit Sequence" on the Help menu. To create an interesting image, start with "dust" then add cycles. The dust gives the background and the cycles give the "closed" curves. The "closed" curves are not really closed. They are however periodic orbits in KAM island chains.
|
|
|
View/Sys/Gal: IMap "IMap0011 4" in "ArtGallery." This iteration is defined by: x <- y-abs(x)/x*sqrt(abs(b*x-c)), y <- a-x. Parameters are: a = .06; b = 1.00; c = -.76; Note: abs(x)/x = sgn(x). Drag around to fill in the image. Click "Center" to refresh the colors. Vary parameter "a" to generate similar images.
|
|
|
View/Sys/Gal: IMap "IMap0011 5" in "ArtGallery." This iteration is defined by: x <- y-abs(x)/x*sqrt(abs(b*x-c)), y <- a-x. Parameters are: a = 2.50; b = .50; c = 1.00; Adjust the parameters.
|
|
|
View/Sys/Gal: IMap "IMap0011 6" in "ArtGallery." This iteration is defined by: x <- y-sqrt(abs(x)), y <- a-x. Parameters are: a = 1.60; Add orbits. Play with "a."
|
|
|
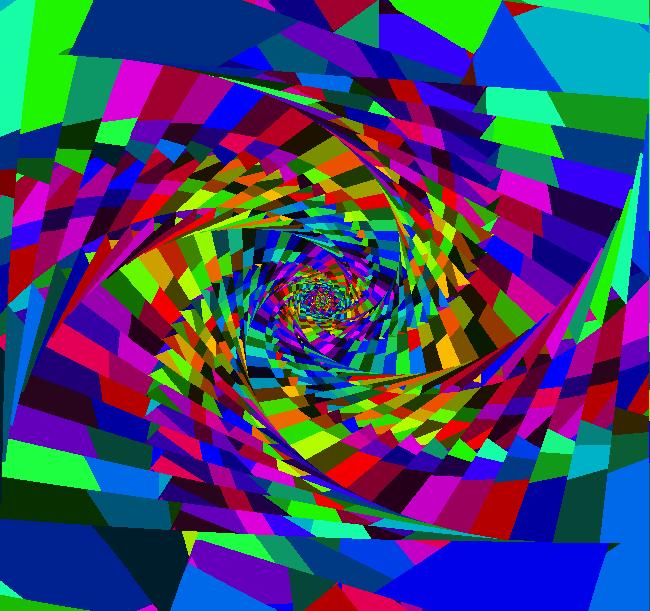
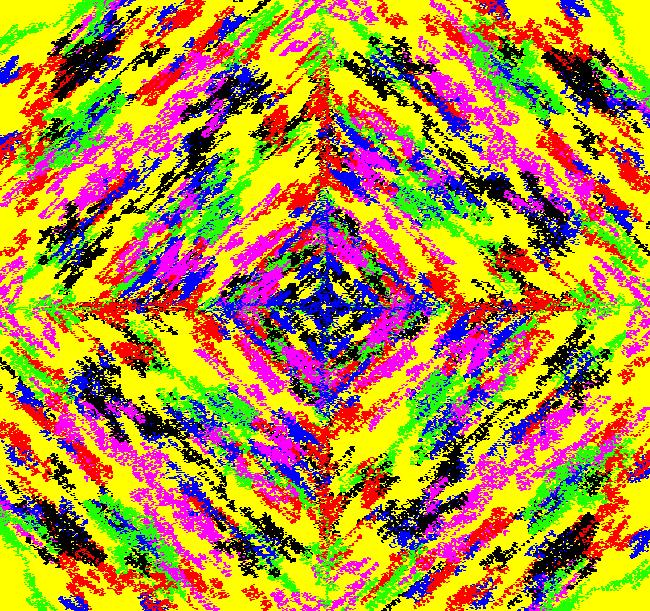
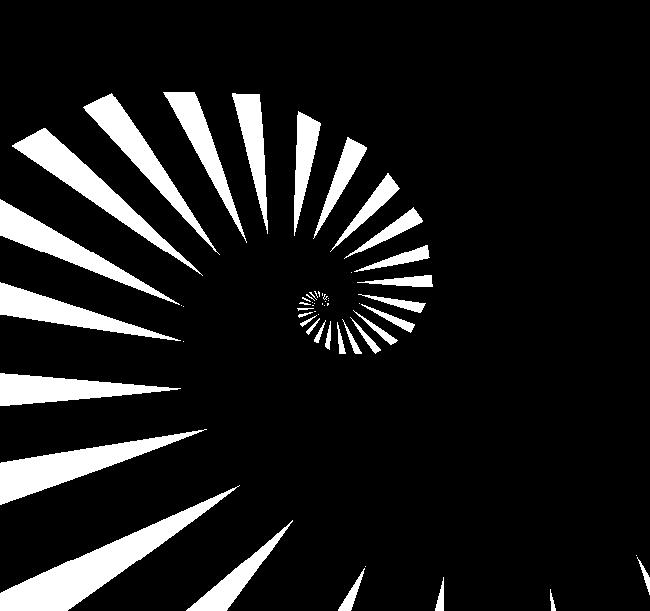
View/Sys/Gal: IMap "IMap0011 7 Jackson Pollock-like images" in "ArtGallery." This iteration is defined by: x <- y-cos(x%b), y <- a-x. Parameters are: a = -1.90; b=2 Play with the parameters. Clear the view and then drag in the graphics area to create your own Pollock-like images. See some actual Jackson Pollock images. See the associated "EMap 10" series.
|
|
|
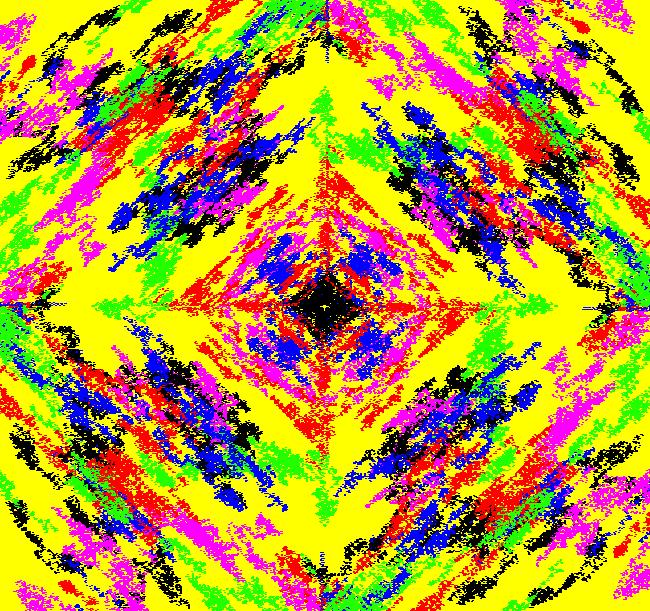
View/Sys/Gal: IMap "IMap0011 7.1 random Pollock-like images" in "ArtGallery." This iteration is defined by: x <- y-cos(x%b), y <- a*(1+random(-.01,.01))-x. Parameters are: a = -1.90; b=2 In the IMap view, each time you click the Center button you get a different image. The use of the random function causes a different IMap to be generated on each click.
|
|
|
View/Sys/Gal: IMap "IMap0011 7.2 an interesting Flow animation" in "ArtGallery." This iteration is defined by: x <- y-cos(x%b), y <- a-x. Parameters are: a = -6.500; b = -6.500; Select "Show 2D IMap Orbit Sequence" on the Help menu. The red orbit (which is too small to see), with seed at (x,y) = (-243.191410,-10.091776), has period 4. Run a Flow animation. Click on the seed then delete the red orbit. Run another flow animation to see how the blue orbit is created (increase the speed and the duration as needed). The seed for the blue orbit is at (x,y) = (1.185185,-1.292929). Deselect "Show 2D IMap Orbit Sequence" and do the flow animation on the blue orbit again. Zoom in and try it again. Center at (0,0), zoom back out, and vary parameters a and b. Each orbit contains 510,000 iterations so you may have to wait a bit to see the redraws.
|
|
|
View/Sys/Gal: IMap "IMap0011 8" in "ArtGallery." This iteration is defined by: x <- y-cos(abs(x)), y <- a-x. Parameters are: a = -2.20; Note: cos(abs(x)) = cos(x).
|
|
|
View/Sys/Gal: IMap "IMap0011 9" in "ArtGallery." This iteration is defined by: x <- y-abs(x)/x*sqrt(abs(b*x-c)), y <- a-x%d. Parameters are: a = 4.90; b = -.23; c = -.33; d = -83.00; Note: abs(x)/x = sgn(x).
|
|
|
View/Sys/Gal: IMap "IMap0011 10" in "ArtGallery." This iteration is defined by: x <- y-abs(x)/x*sqrt(abs(b*x-c)), y <- a-x%d. Parameters are: a = 4.90; b = -.23; c = -.33; d = -83.00; Note: abs(x)/x = sgn(x).
|
|
|
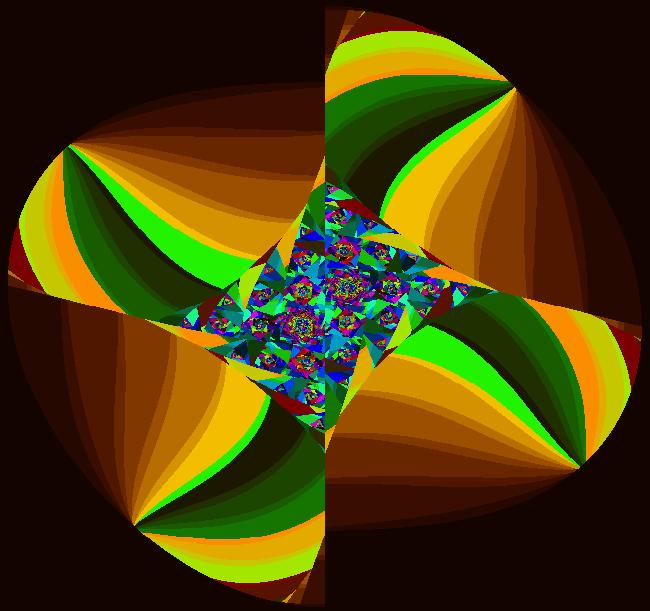
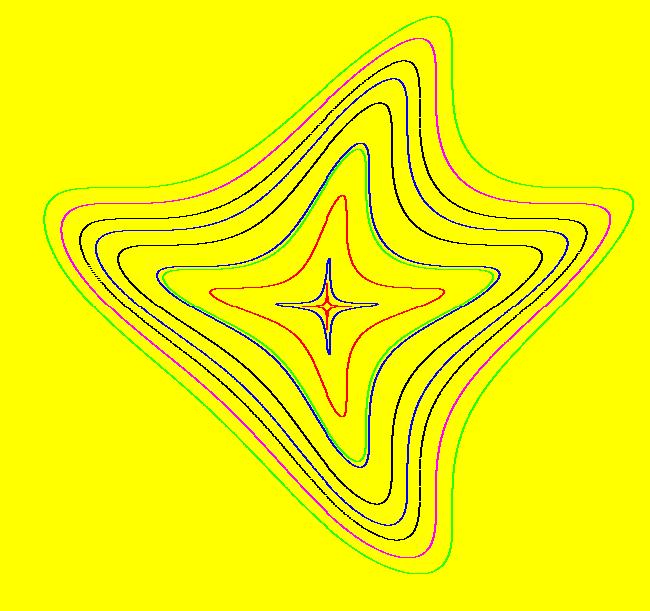
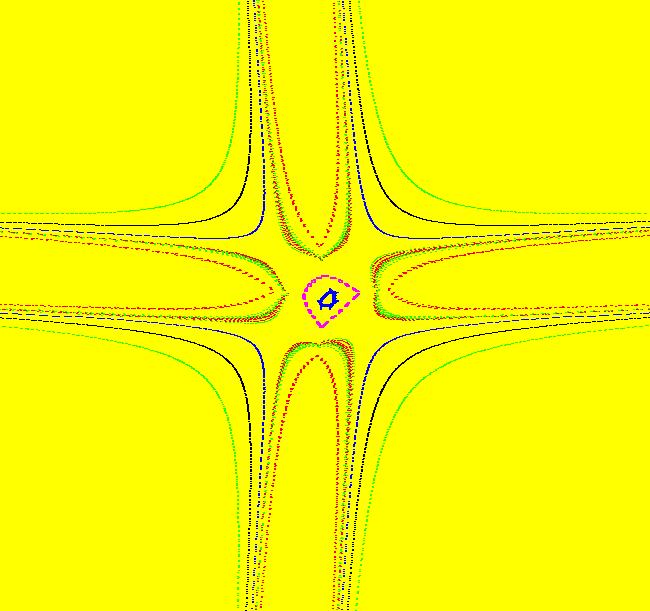
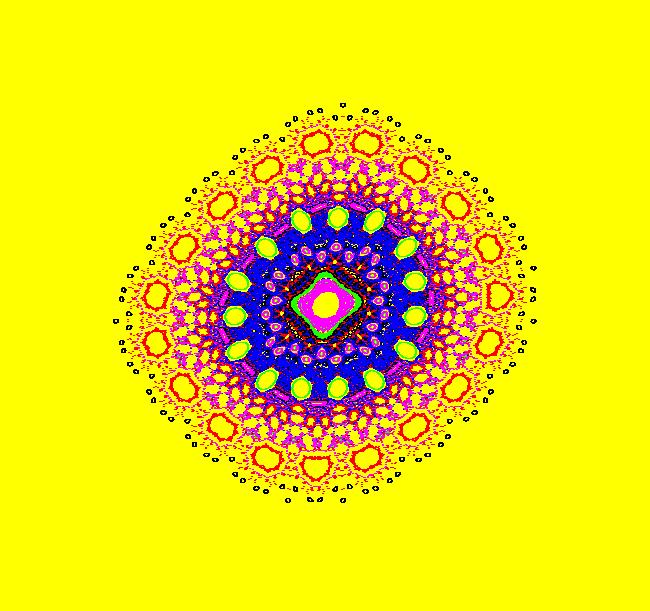
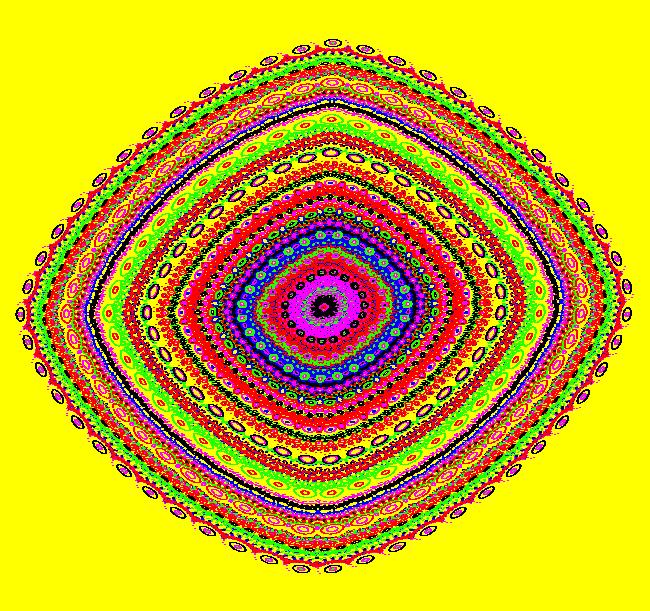
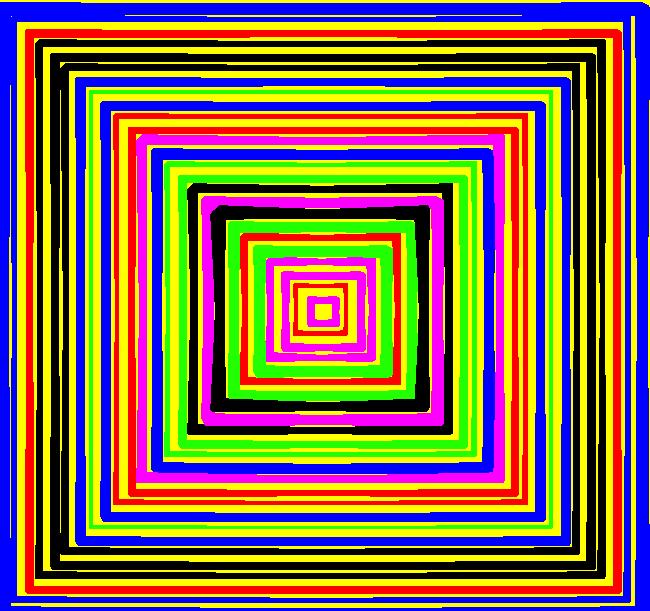
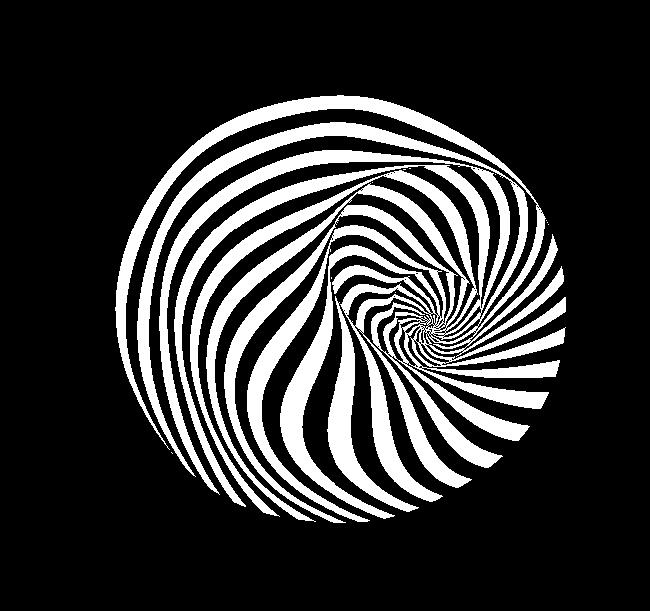
View/Sys/Gal: IMap "IMap1011 12 square bullseye" in "ArtGallery." This iteration is defined by: x <- y-cos(x), y <- a-x. Parameters are: a = -1.90; Vary parameter "a." Turn "Show 2D IMap Orbit Sequence" off, on the Help menu to see how this image is constructed. Note that the seeds are near the diagonal lines y = +-x. Some more things to try: zoom in once and start several more orbits near the center of the image.
|
|
|
View/Sys/Gal: EMap "new EMapCT0" in "ArtGallery." This iteration is defined by: x <- y-cos(x%b), y <- a-x. Parameters are: a = 5.0000; b = -3.7000; EMap CT: 0
|
|
|
View/Sys/Gal: EMap "new EMapCT1" in "ArtGallery." This iteration is defined by: x <- y-abs(x)/x*sqrt(abs(b*x-c)), y <- a-x%d. Parameters are: a = .7000; b = .0000; c = 8.5000; d = 86.0000; EMap CT: 1
|
|
|
View/Sys/Gal: EMap "new EMapCT1 14.5" in "ArtGallery." This iteration is defined by: x <- (1+s*.1)*(y-cos(x%b)), y <- (1+s*.1)*(a-x). Parameters are: a = -2.8000; b = 3.6000; s = .0012; EMap CT: 1
|
|
|
View/Sys/Gal: EMap "new EMapCT3" in "ArtGallery." This iteration is defined by: x <- y-cos(x%b), y <- a-x. Parameters are: a = 6.2000; b = -.5000; EMap CT: 3
|
|
|
View/Sys/Gal: EMap "new EMapCT3 14.5" in "ArtGallery." This iteration is defined by: x <- (1+s*.1)*(y-cos(x%b)), y <- (1+s*.1)*(a-x). Parameters are: a = -2.7000; b = 3.6000; s = .0000; EMap CT: 3
|
|
|
View/Sys/Gal: EMap "new EMapMaxCT3" in "ArtGallery." This iteration is defined by: x <- y-cos(x%b), y <- a-x. Parameters are: a = 6.1000; b = -.5000; EMap CT: 3
|
|
|
View/Sys/Gal: EMap "new EMapMaxCT3 4.1" in "ArtGallery." This iteration is defined by: x <- y-sgn(x)*cos(b*x-c), y <- a-x. Parameters are: a = .7400; b = .4700; c = .0700; EMap CT: 3
|
|
|
View/Sys/Gal: EMap "new EMapMaxCT9" in "ArtGallery." This iteration is defined by: x <- (1+s*.1)*(sin(x)*cosh(y)+p), y <- (1+s*.1)*(cos(x)*sinh(y)+q). Parameters are: p = .0990; q = .5200; s = 5.9000; EMap CT: 9
|
|
|
View/Sys/Gal: EMap "new EMapMaxCT9 1.2" in "ArtGallery." This iteration is defined by: x <- x+h*(y-cos(x)), y <- y+h*(a-x). Parameters are: a = 2.9000; h = .1400; EMap CT: 9
|
|
|
View/Sys/Gal: EMap "new EMapMaxCT9 4.3b" in "ArtGallery." This iteration is defined by: x <- (1+s*.1)*(y-sgn(x)*cos(b*x-c)), y <- (1+s*.05)*(a-x). Parameters are: a = -.0160; b = .3100; c = .0100; s = .8200; EMap CT: 9
|
|
|
View/Sys/Gal: EMap "new* EMapMaxCT0 4.1" in "ArtGallery." This iteration is defined by: x <- y-sgn(x)*cos(b*x-c), y <- a-x. Parameters are: a = .75; b = .47; c = .07; EMap CT: 0
|
|
|
View/Sys/Gal: EMap "new* EMapMaxCT1 4.4b" in "ArtGallery." This iteration is defined by: x <- (1+s*.1)*(y-sgn(x)*cos(b*x-c)), y <- (1+s*.05)*(a-x). Parameters are: a = -.0600; b = -.4200; c = .1900; s = .0000; EMap CT: 1
|
|
|
View/Sys/Gal: EMap "new* EMapMaxCT1 4.4c" in "ArtGallery." This iteration is defined by: x <- (1+s*.1)*(y-sgn(x)*cos(b*x-c)), y <- (1+s*.05)*(a-x). Parameters are: a = -.0600; b = -.4200; c = .1900; s = .0000; EMap CT: 1
|
|
|
View/Sys/Gal: EMap "new* EMapMaxCT5 4.4" in "ArtGallery." This iteration is defined by: x <- (1+s*.1)*(y-sgn(x)*cos(b*x-c)), y <- (1+s*.05)*(a-x). Parameters are: a = -.0600; b = .6200; c = .0240; s = .1000; EMap CT: 5
|
|
|
View/Sys/Gal: EMap "new* EMapMaxCT5 13" in "ArtGallery." This iteration is defined by: x <- y-sgn(x)*sqrt(abs(b%x-c)), y <- a-x*d. Parameters are: a = -.4700; b = -4.7000; c = 9.4000; d = 1.1000; EMap CT: 5
|
|
|
View/Sys/Gal: EMap "new* EMapMaxCT5 13.1" in "ArtGallery." This iteration is defined by: x <- y-sgn(x)*sqrt(abs(b%x-c)), y <- a-x*d. Parameters are: a = -.47; b = -4.70; c = 9.40; d = 1.10; EMap CT: 5
|
|
|
View/Sys/Gal: EMap "new* EMapMaxCT5 13b" in "ArtGallery." This iteration is defined by: x <- y-sgn(x)*sqrt(abs(b%x-c)), y <- a-x*d. Parameters are: a = .2300; b = -4.7000; c = 9.4000; d = 1.1000; EMap CT: 5
|
|
|
View/Sys/Gal: EMap "new* EMapMaxCT5 14.5" in "ArtGallery." This iteration is defined by: x <- (1+s*.1)*(y-cos(x%b)), y <- (1+s*.1)*(a-x). Parameters are: a = -2.8000; b = 3.6000; s = .0620; EMap CT: 5
|
|
|
View/Sys/Gal: EMap "new* EMapMaxCT7 7.3" in "ArtGallery." This iteration is defined by: x <- y-sgn(x)*sqrt(abs(b*x-c)), y <- a-x%d. Parameters are: a = 4.90; b = -.12; c = -.33; d = -83.00; EMap CT: 7
|
|
|
View/Sys/Gal: EMap "new* EMapMaxCT9 4.4d" in "ArtGallery." This iteration is defined by: x <- (1+s*.1)*(y-sgn(x)*cos(b*x-c)), y <- (1+s*.05)*(a-x). Parameters are: a = -.0600; b = .6200; c = .0240; s = 1.0000; EMap CT: 9
|
|
|
View/Sys/Gal: EMap "new* EMapMaxCT9 4.4e" in "ArtGallery." This iteration is defined by: x <- (1+s*.1)*(y-sgn(x)*cos(b*x-c)), y <- (1+s*.05)*(a-x). Parameters are: a = -.0600; b = -.4200; c = .1000; s = .0000; EMap CT: 9
|
|
|
View/Sys/Gal: EMap "new** EMapCT0 11.7" in "ArtGallery." This iteration is defined by: x <- y-sqrt(abs(x%c)), y <- a-x%b. Parameters are: a = .9100; b = -6.2000; c = 5.1000;
|
|
|
View/Sys/Gal: EMap "new** EMapCT5 11.8" in "ArtGallery." This iteration is defined by: x <- y-sqrt(abs(x%c)), y <- a-x%b. Parameters are: a = .40; b = -8.40; c = 5.10;
|
|
|
View/Sys/Gal: EMap "new** EMapMaxCT2 4.7" in "ArtGallery." This iteration is defined by: x <- (1+s*.1)*(y-sgn(x)*cos(b*x-c)), y <- (1+s*.05)*(a-x). Parameters are: a = 1.0000; b = -.6600; c = -4.4000; s = 1.0000; EMap CT: 2
|
|
|
View/Sys/Gal: EMap "new** EMapMaxCT2 4.8" in "ArtGallery." This iteration is defined by: x <- (1+s*.1)*(y-sgn(x)*sin(b*x-c)), y <- (1+s*.05)*(a-x). Parameters are: a = .0240; b = .5000; c = -.0530; s = .2000; EMap CT: 2
|
|
|
View/Sys/Gal: EMap "new** EMapMaxCT5 13.5" in "ArtGallery." This iteration is defined by: x <- y-sgn(x)*sqrt(abs(b%x-c)), y <- a-x*d. Parameters are: a = .0500; b = -4.7000; c = 9.4000; d = 1.2000; EMap CT: 5
|
|
|
View/Sys/Gal: EMap "new** EMapMaxCT5 4.7" in "ArtGallery." This iteration is defined by: x <- (1+s*.1)*(y-sgn(x)*cos(b*x-c)), y <- (1+s*.05)*(a-x). Parameters are: a = 1.0000; b = -.6600; c = -4.4000; s = 1.0000; EMap CT: 5
|
|
|
View/Sys/Gal: EMap "new*** EMapCT2 16.1" in "ArtGallery." This iteration is defined by: x <- (1+s*.1)*(y-step(x)*cos(b*x-c)), y <- (1+s*.05)*(a-x). Parameters are: a = -.0600; b = .6200; c = -.0550; s = 2.3000; EMap CT: 2 Try zooming in and out.
|
|
|
View/Sys/Gal: EMap "new*** EMapCT5 16.2" in "ArtGallery." This iteration is defined by: x <- (1+s*.1)*(y-step(x)*cos(b*x-c)), y <- (1+s*.05)*(a-x). Parameters are: a = -.0600; b = -.8500; c = -.0690; s = 2.3000; EMap CT: 5
|
|
|
View/Sys/Gal: EMap "new*** EMapCT5 16.4" in "ArtGallery." This iteration is defined by: x <- (1+s*.1)*(y-step(x)*cos(b*x-c)), y <- (1+s*.05)*(a-y). Parameters are: a = -.0600; b = .6100; c = -.0550; s = 2.3000; EMap CT: 5
|
|
|
View/Sys/Gal: EMap "new*** EMapMaxCT0 4.1" in "ArtGallery." This iteration is defined by: x <- y-sgn(x)*cos(b*x-c), y <- a-x. Parameters are: a = .75; b = .47; c = .07; EMap CT: 0
|
|
|
View/Sys/Gal: EMap "new*** EMapMaxCT2" in "ArtGallery." This iteration is defined by: x <- y-abs(x)/x*sqrt(abs(b*x-c)), y <- a-x%d. Parameters are: a = 1.0000; b = .1000; c = 8.5000; d = 86.0000; EMap CT: 2
|
|
|
View/Sys/Gal: EMap "new*** EMapMaxCT2 16" in "ArtGallery." This iteration is defined by: x <- (1+s*.1)*(y-sgn(x)*sin(b*x-c)), y <- (1+s*.05)*(a-x). Parameters are: a = .0100; b = -.0400; c = -.0280; s = .2000; EMapMax CT: 2
|
|
|
View/Sys/Gal: EMap "new*** EMapMaxCT2 16.2" in "ArtGallery." This iteration is defined by: x <- (1+s*.1)*(y-step(x)*sin(b*x-c)), y <- (1+s*.05)*(a-x). Parameters are: a = .0100; b = -.0400; c = -.0280; s = .2000; EMapMax CT: 2
|
|
|
View/Sys/Gal: EMap "new*** EMapMaxCT2 16.3" in "ArtGallery." This iteration is defined by: x <- x+h*(y-cos(x)), y <- y+h*(a-x). Parameters are: a = 2.9; h=.07 EMapMax CT: 2 Also see: CTs 3 and 6 Max.
|
|
An OdeFactory Slide Show Click on a slide to zoom in. Click "video" to see a video. |
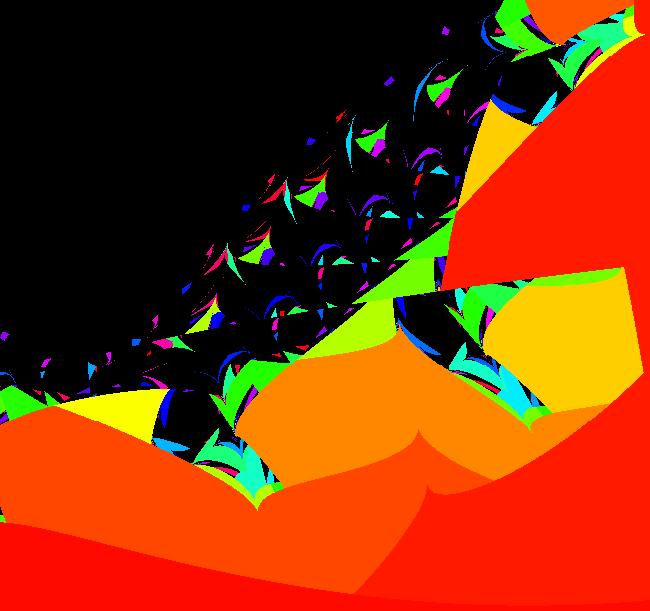
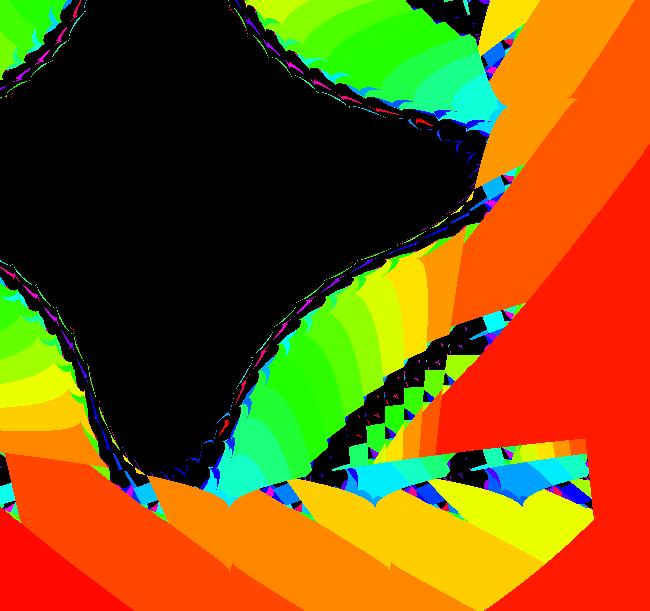
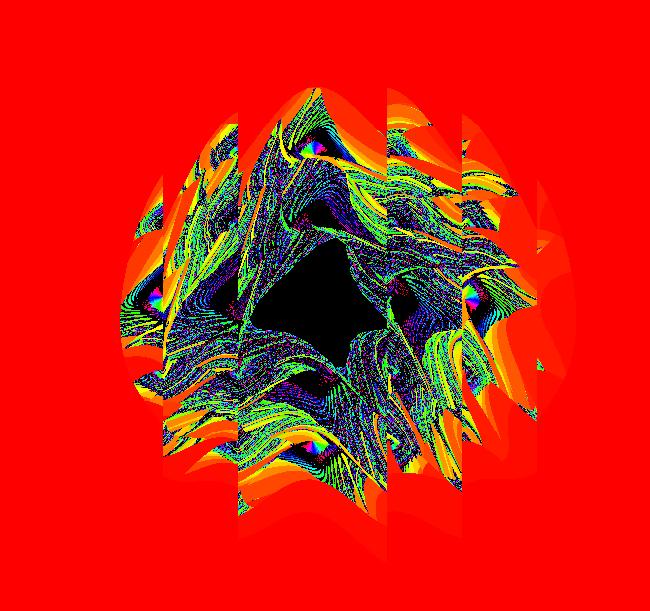
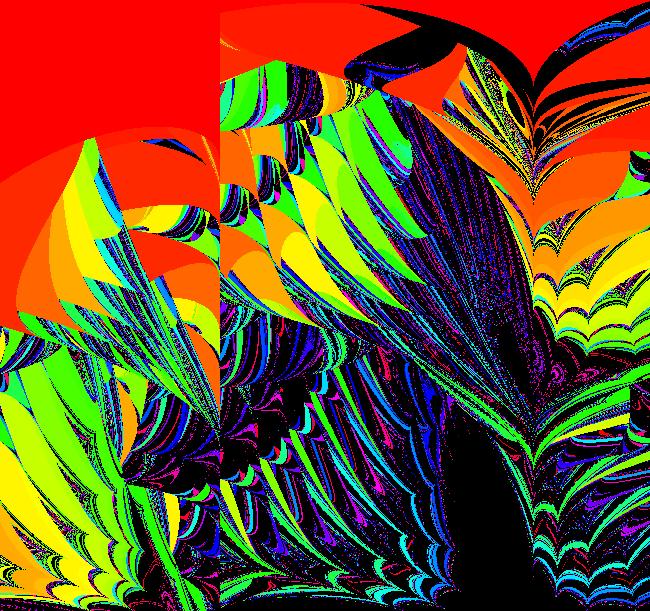
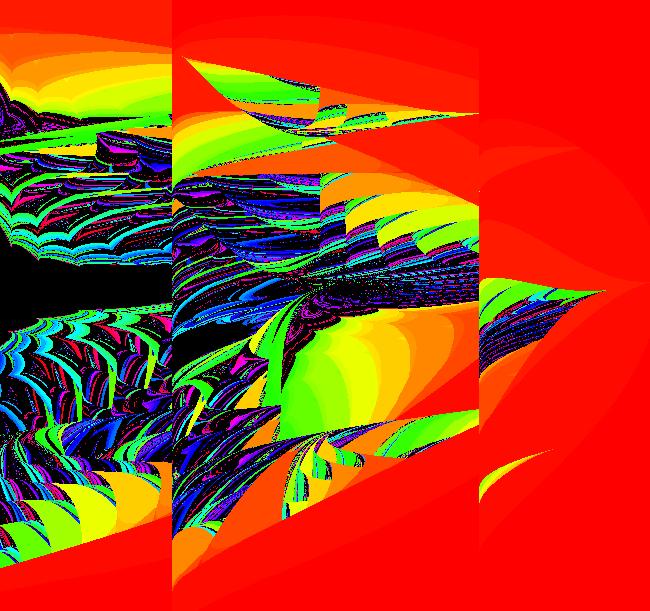
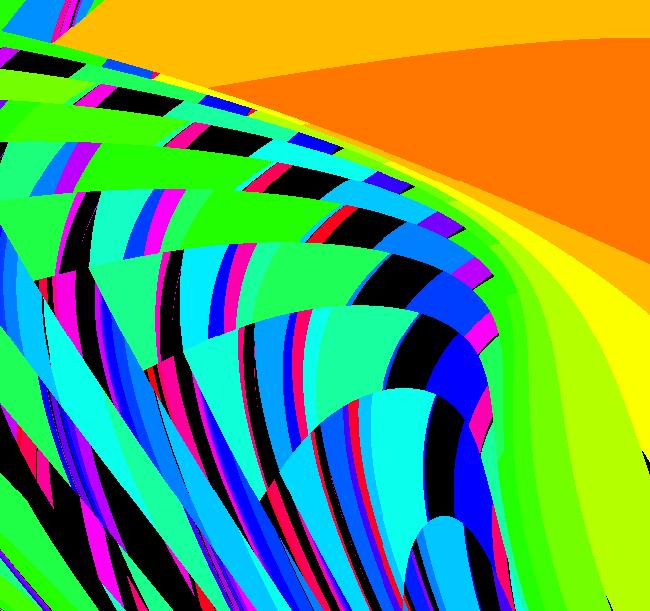
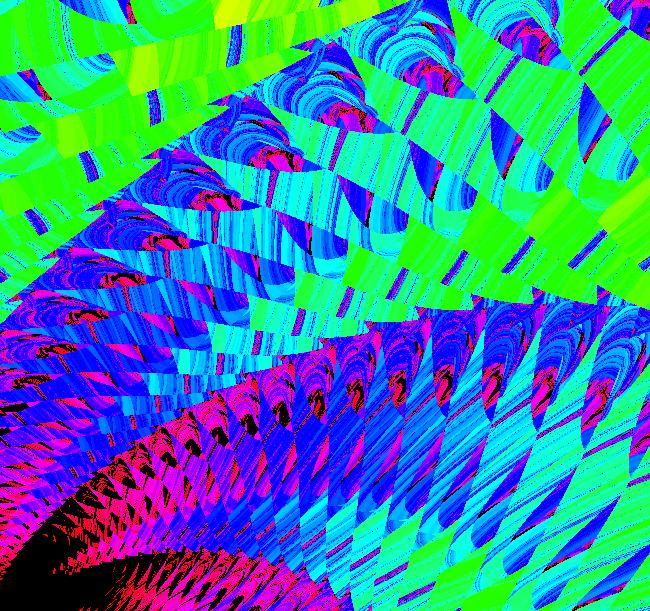
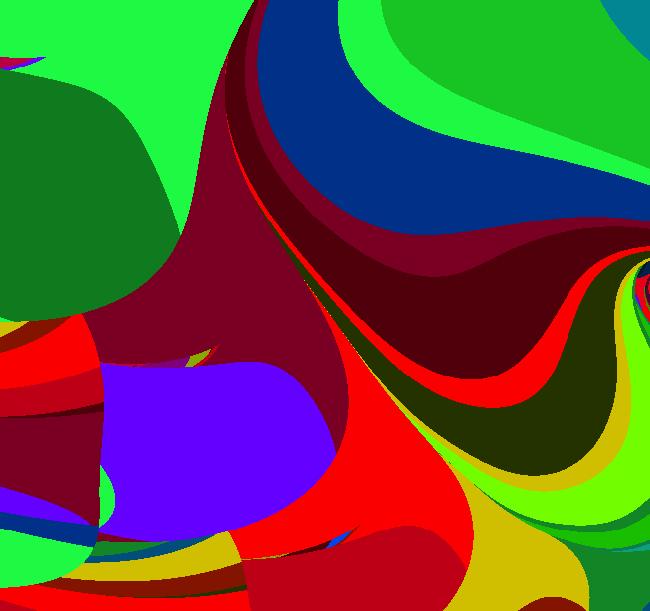
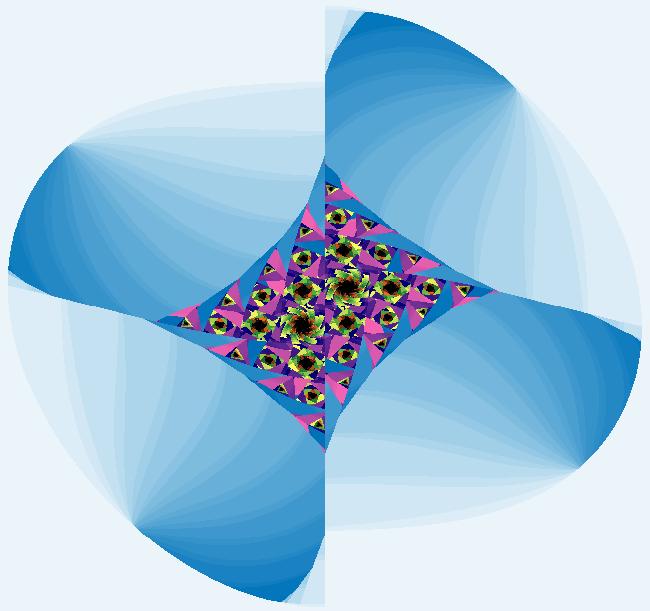
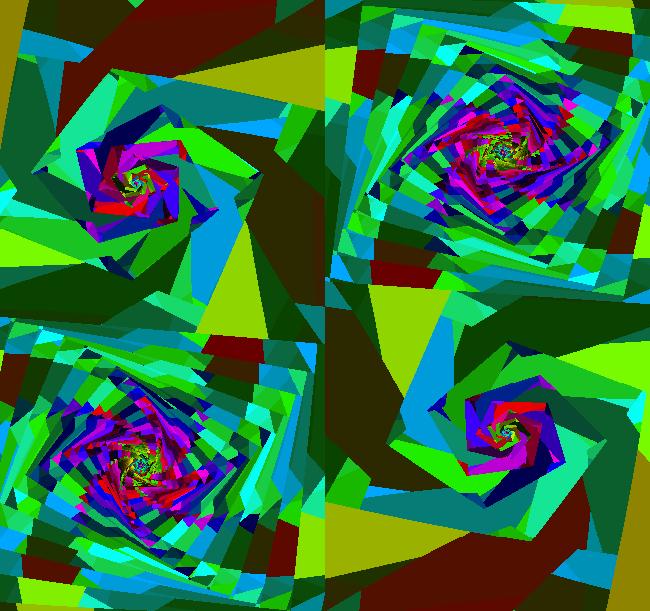
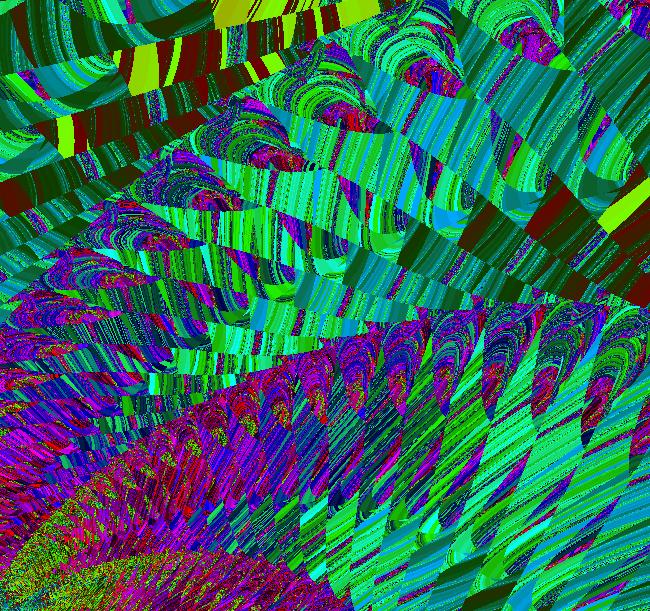
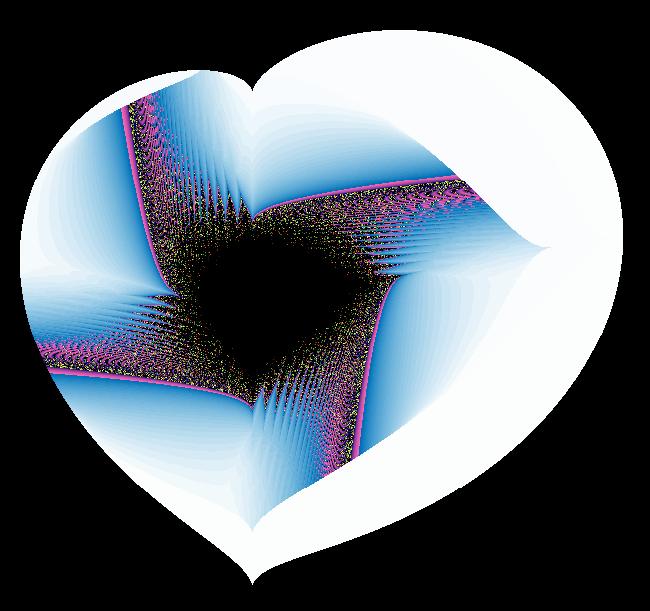
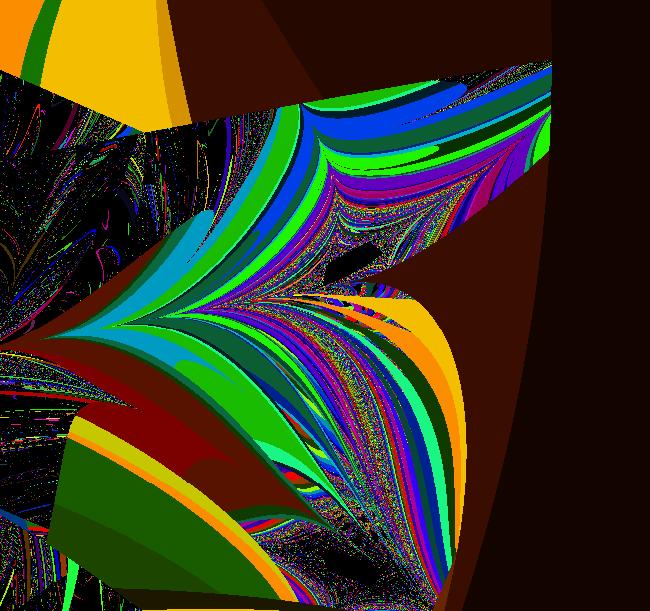
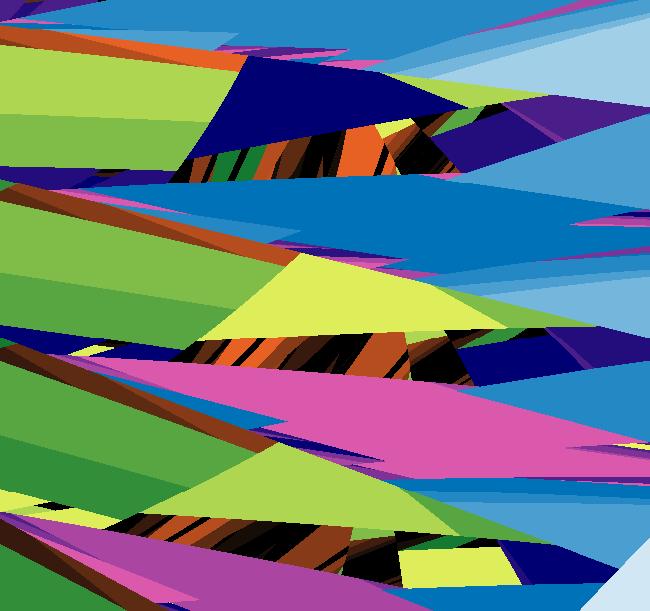
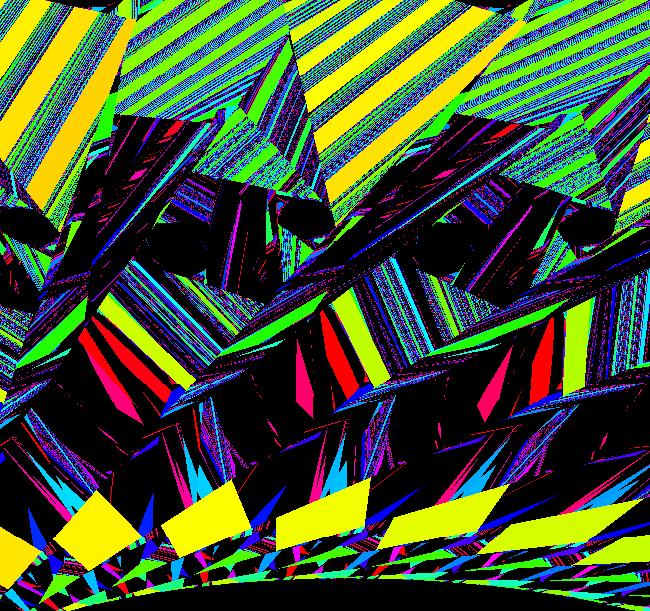
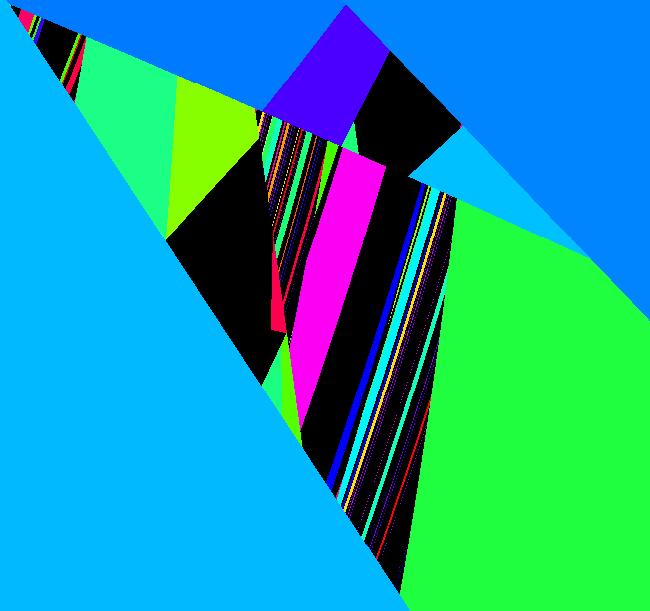
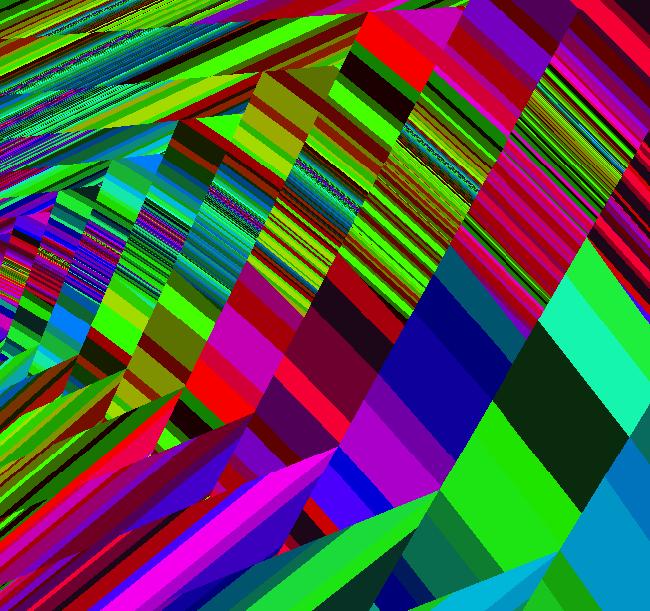
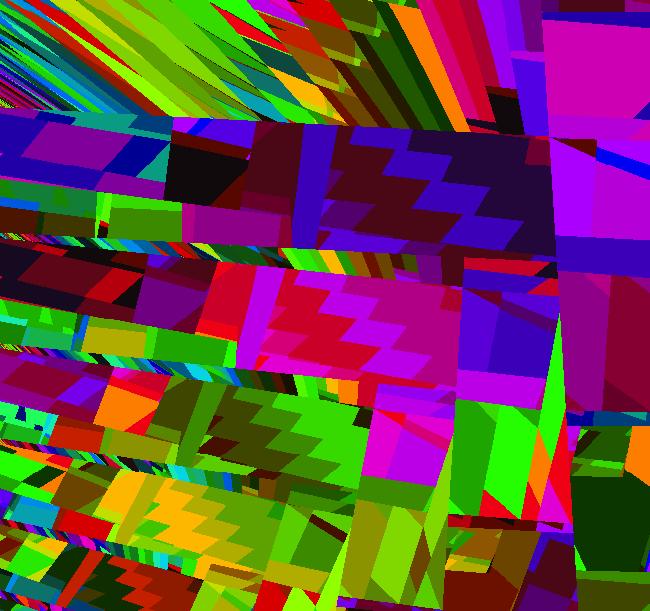
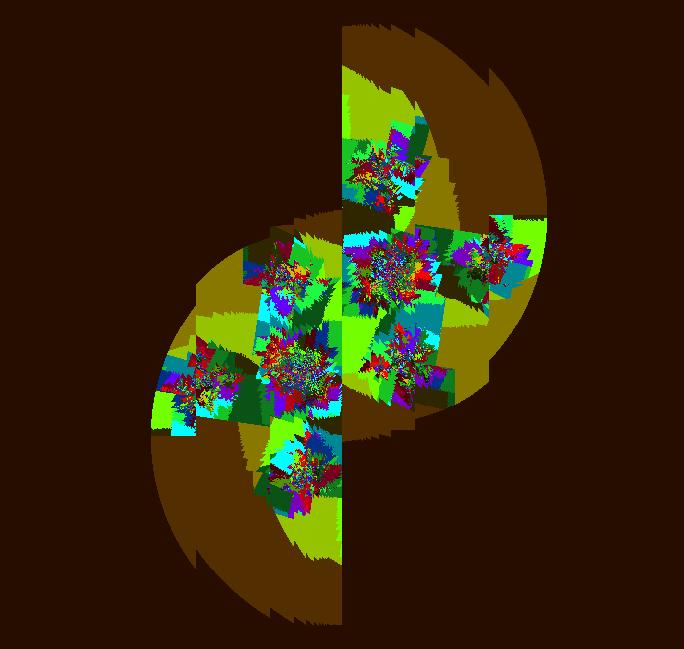
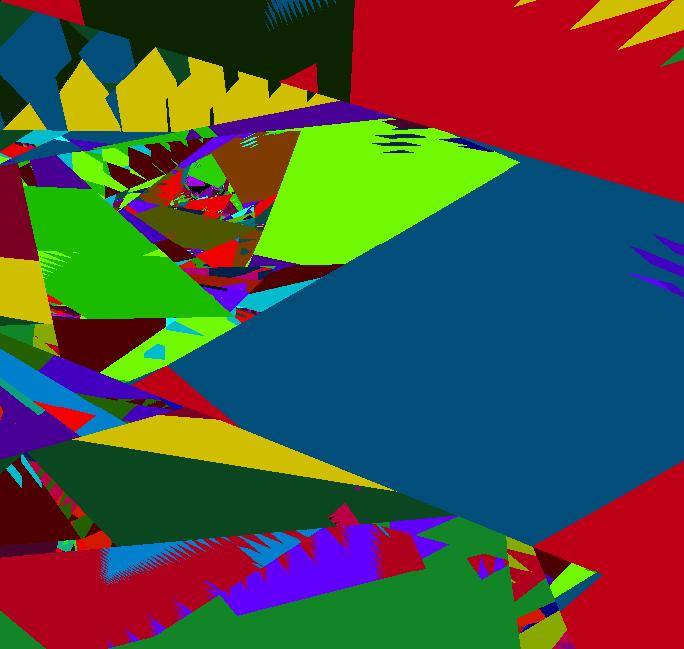
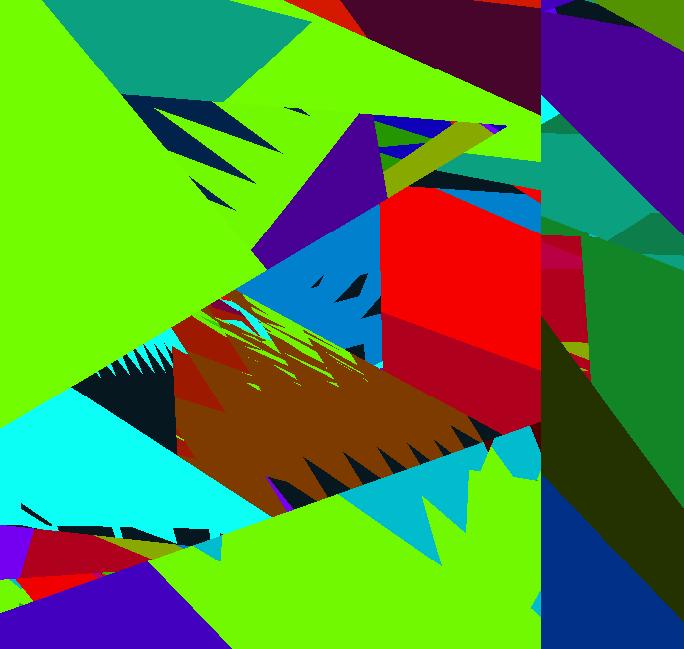
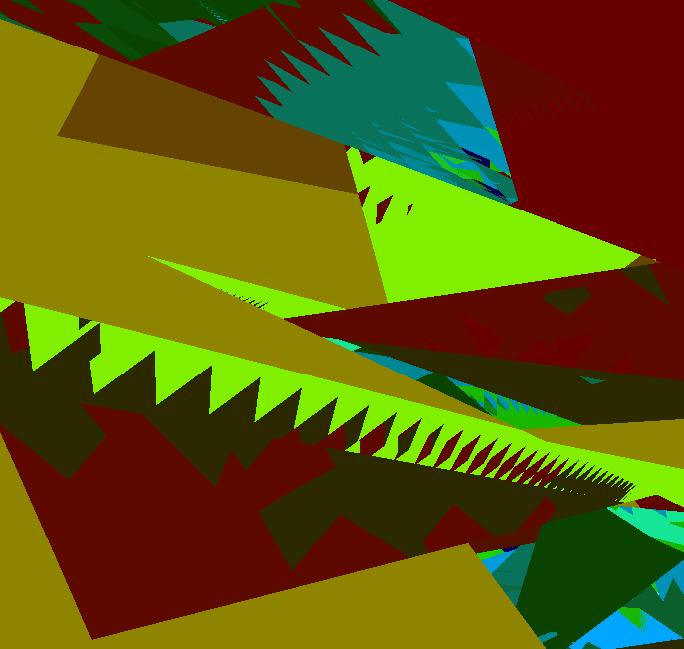
View/Sys/Gal: Ode "new*** Creating Nonfractal Art Images" in "ArtGallery." All images in OdeFactory are defined by vector fields. Most often OdeFactory "art" images are EMap views of 2D nonsmooth systems. The style of the art is called: Nonsmooth systems tend to give geometric hard-edge generative art similar in style to hand drawn abstract art. A single nonsmooth system can generate many interesting images when different zoomed-in viewing regions are used. The viewing regions, which is where the computations are done, get mapped to the rectangular graphics window, where the results are displayed. A zoomed-in region has a smaller area, that is, (vMax-vMin)*(hMax-hMin) gets smaller. The following set of images are all simply zoomed-in parts of the first image which is defined by x <- y-sgn(x)*sqrt(abs(b%x-c)), y <- a-x*d, with parameters a = .2300; b = -4.7000; c = 9.4000; d = 1.1000. Various color tables were used on zoomed-in images.
|
|
|
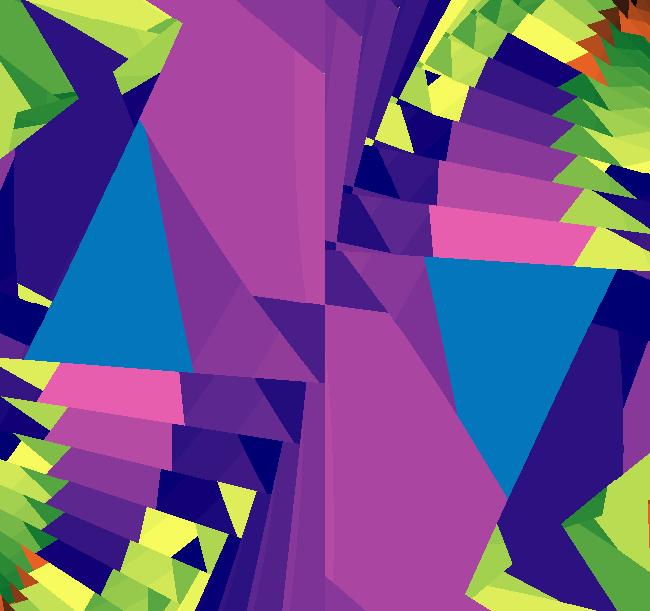
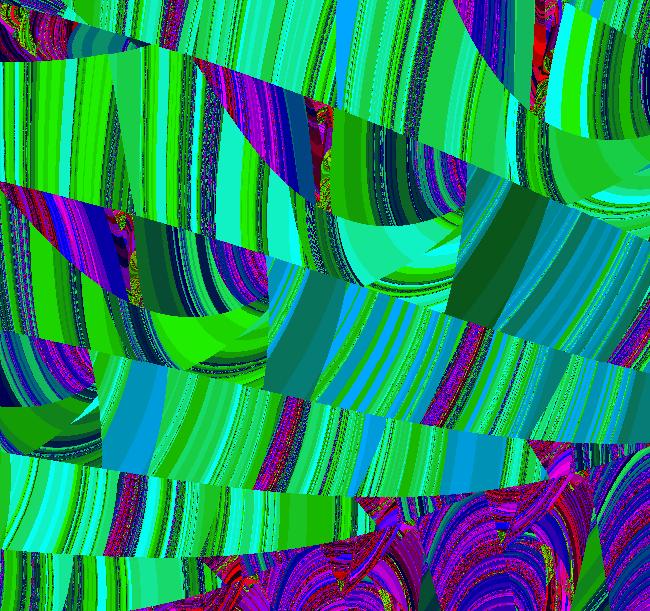
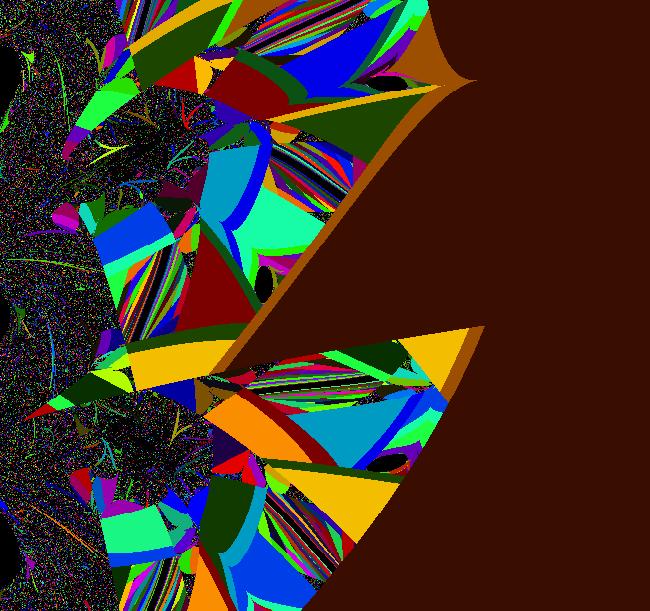
View/Sys/Gal: EMap "new*** EMapCT2 13b region 1" in "ArtGallery." This iteration is defined by: x <- y-sgn(x)*sqrt(abs(b%x-c)), y <- a-x*d. Parameters are: a = .2300; b = -4.7000; c = 9.4000; d = 1.1000; EMap CT: 5 Somewhat interesting but obviously not hand dome. Area of viewing region = 484. All the interesting detail is hidden.
|
|
|
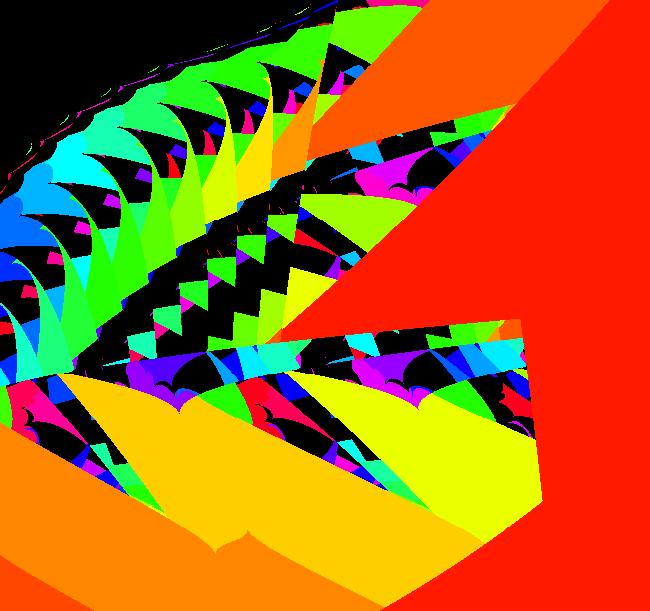
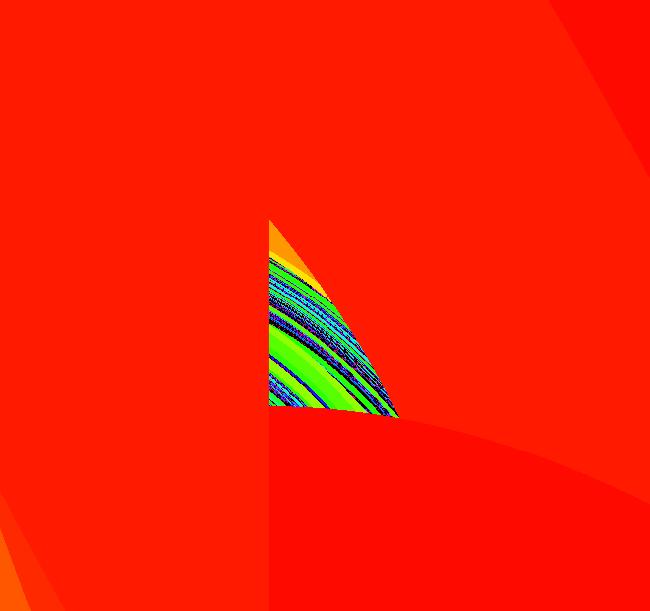
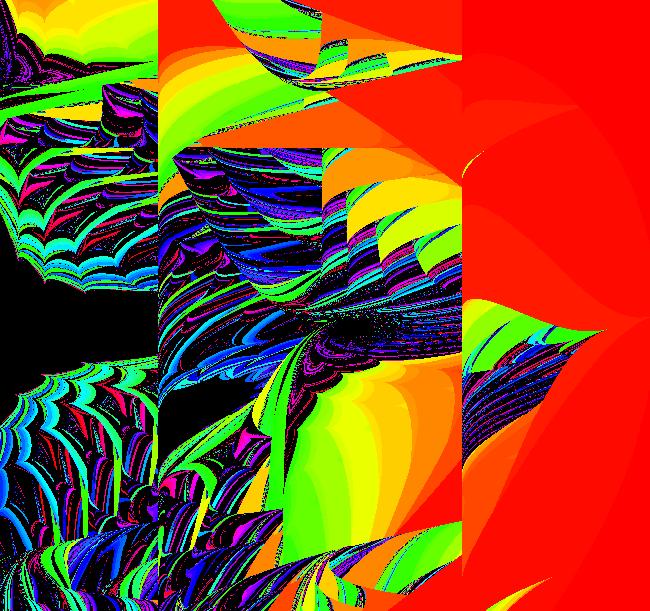
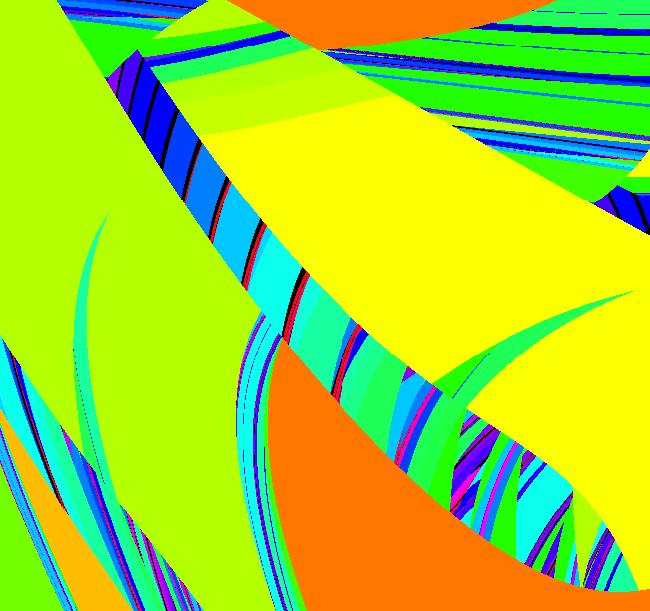
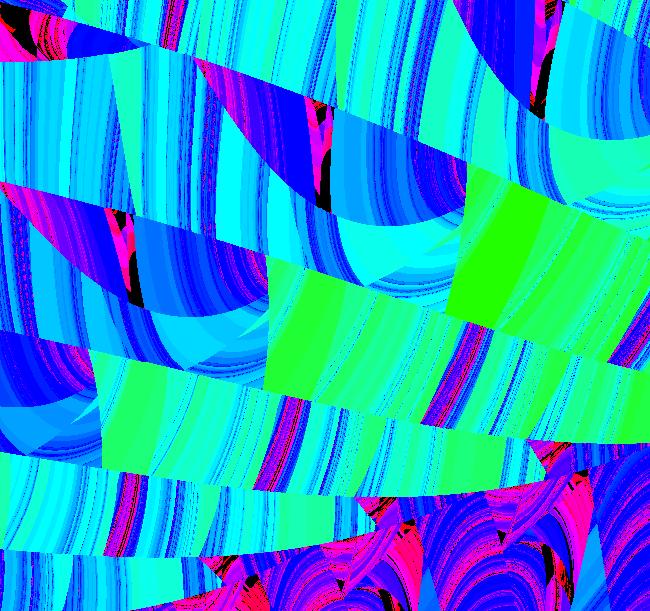
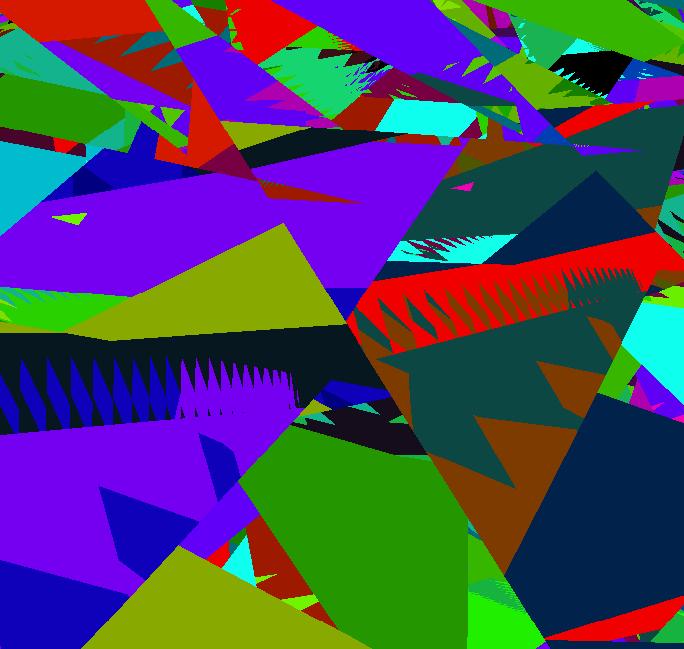
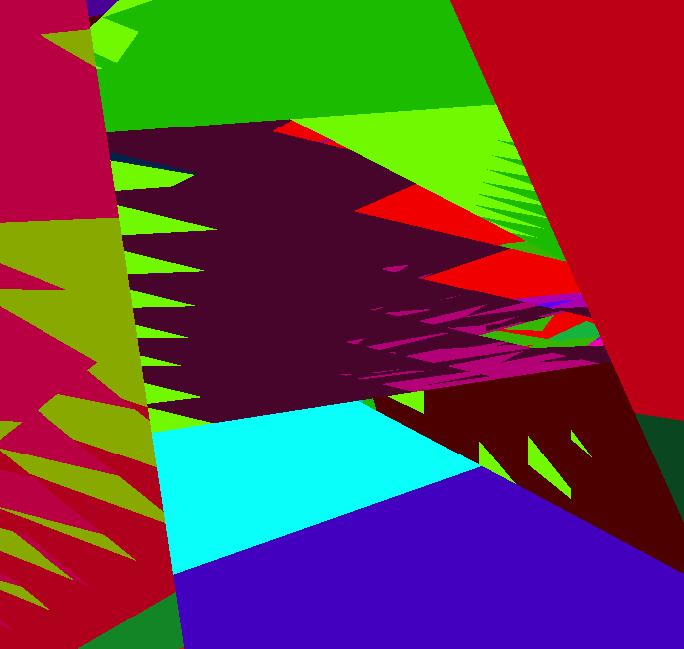
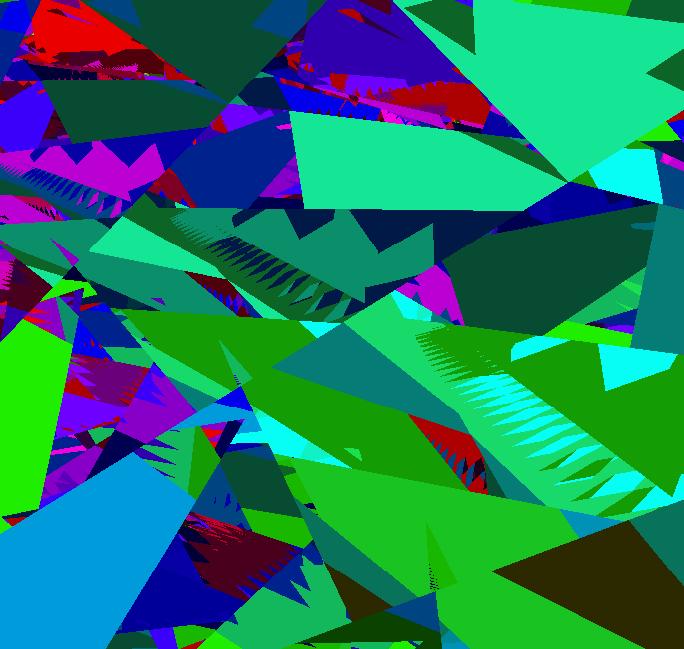
View/Sys/Gal: EMap "new*** EMapCT2 13b region 2" in "ArtGallery." This iteration is defined by: x <- y-sgn(x)*sqrt(abs(b%x-c)), y <- a-x*d. Parameters are: a = .2300; b = -4.7000; c = 9.4000; d = 1.1000; EMap CT: 2 Also try: CT3, CT5, CT6 and CT9. This is still a bit too busy. Area of viewing region ~ .002.
|
|
|
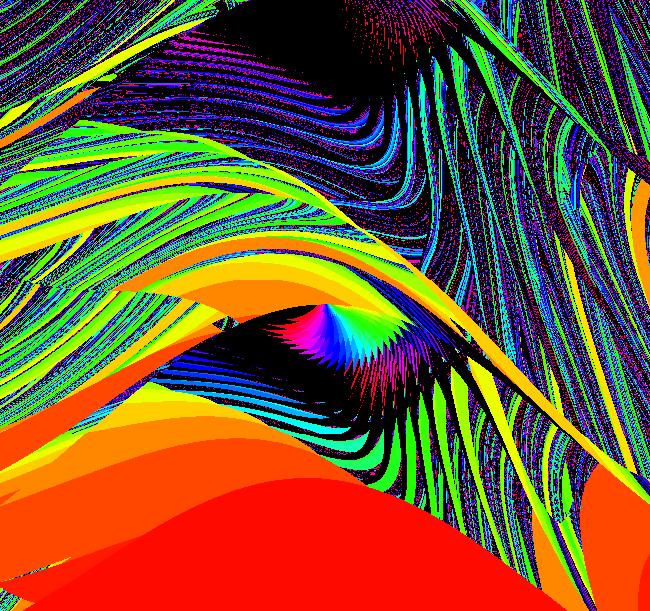
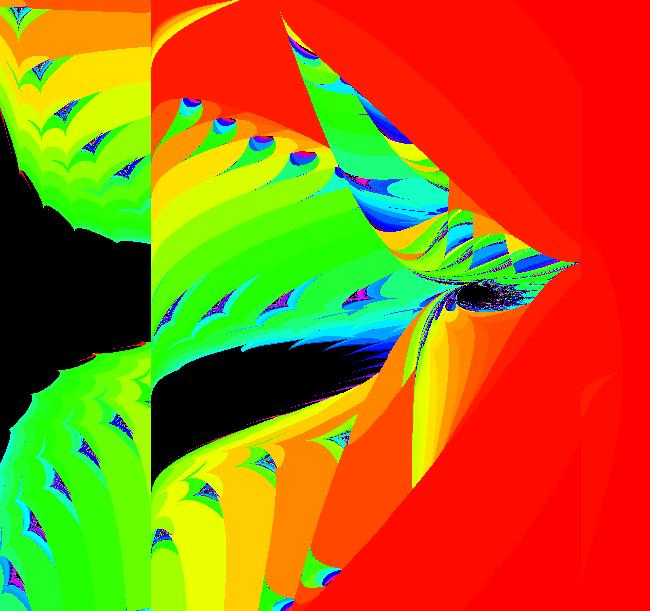
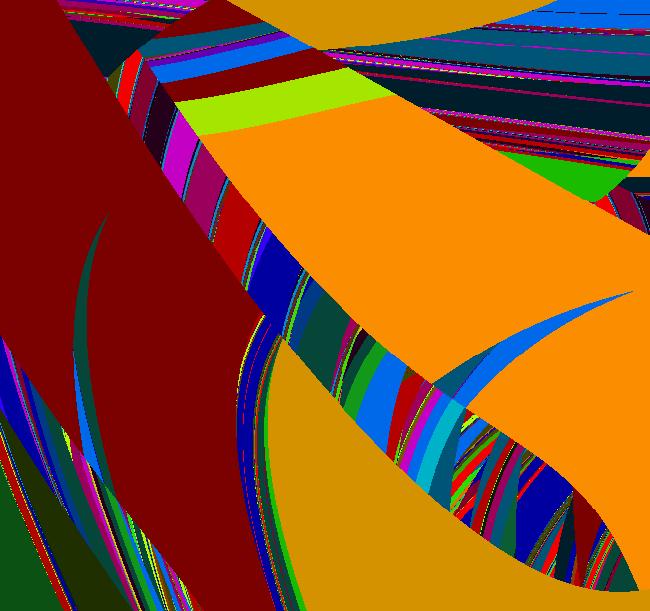
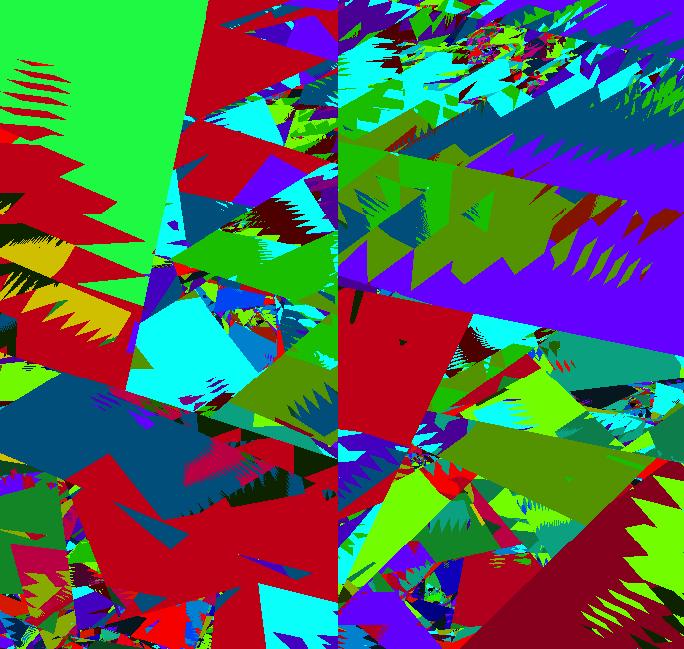
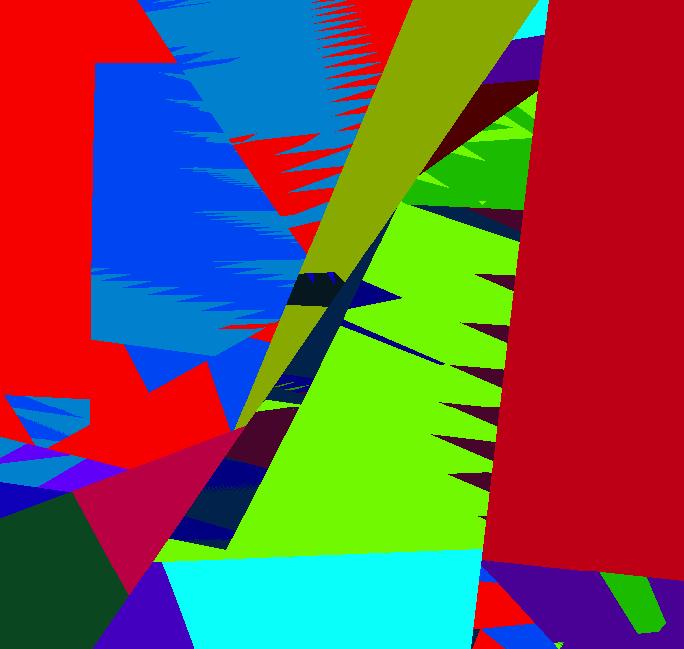
View/Sys/Gal: EMap "new*** EMapCT2 13b region 3" in "ArtGallery." This iteration is defined by: x <- y-sgn(x)*sqrt(abs(b%x-c)), y <- a-x*d. Parameters are: a = .2300; b = -4.7000; c = 9.4000; d = 1.1000; EMap CT: 2 Another busy image. Area of viewing region ~ .6.
|
|
|
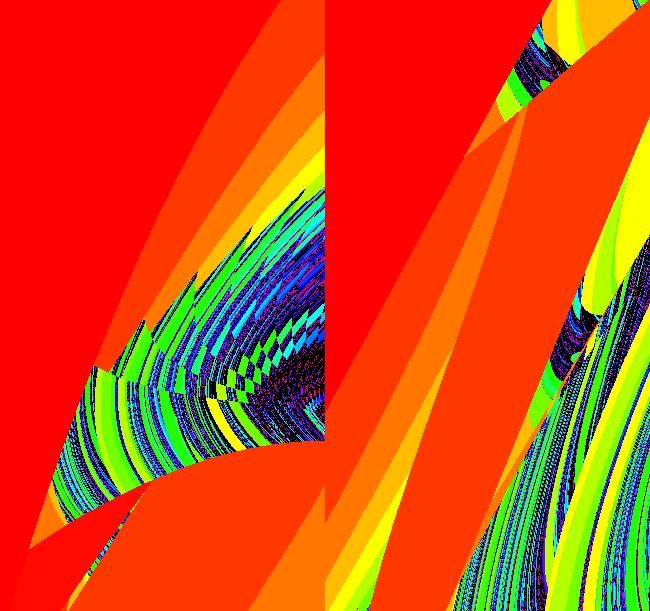
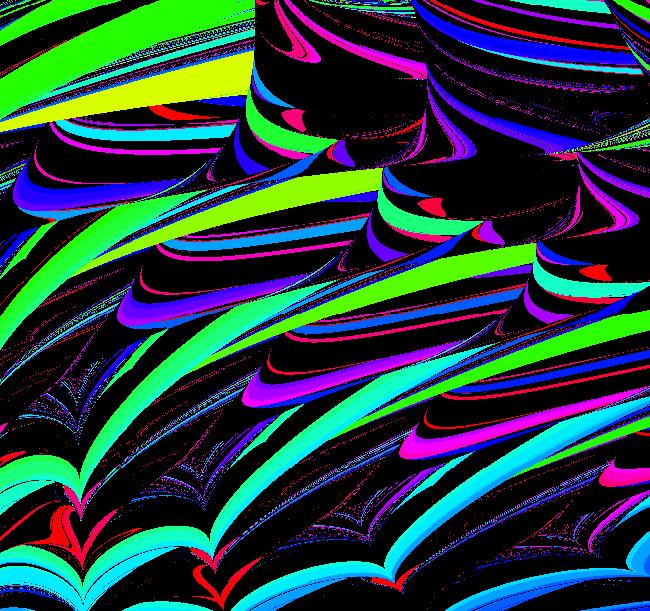
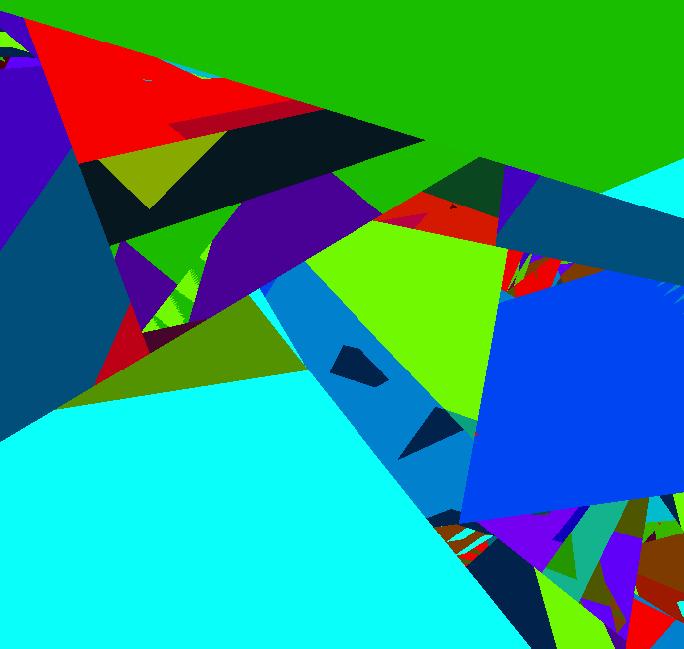
View/Sys/Gal: EMap "new*** EMapCT2 13b region 4" in "ArtGallery." This iteration is defined by: x <- y-sgn(x)*sqrt(abs(b%x-c)), y <- a-x*d. Parameters are: a = .2300; b = -4.7000; c = 9.4000; d = 1.1000; EMap CT: 2 Area of viewing region ~ .04.
|
|
|
View/Sys/Gal: EMap "new*** EMapCT2 13b region 5" in "ArtGallery." This iteration is defined by: x <- y-sgn(x)*sqrt(abs(b%x-c)), y <- a-x*d. Parameters are: a = .2300; b = -4.7000; c = 9.4000; d = 1.1000; EMap CT: 2 Too busy? Area of viewing region ~ .044.
|
|
|
View/Sys/Gal: EMap "new*** EMapCT2 13b region 6" in "ArtGallery." This iteration is defined by: x <- y-sgn(x)*sqrt(abs(b%x-c)), y <- a-x*d. Parameters are: a = .2300; b = -4.7000; c = 9.4000; d = 1.1000; EMap CT: 2 A bit busy but interesting. Area of viewing region ~ .004.
|
|
|
View/Sys/Gal: EMap "new*** EMapCT2 13b region 7" in "ArtGallery." This iteration is defined by: x <- y-sgn(x)*sqrt(abs(b%x-c)), y <- a-x*d. Parameters are: a = .2300; b = -4.7000; c = 9.4000; d = 1.1000; EMap CT: 2 Interesting image. Area of viewing region ~ .003.
|
|
|
View/Sys/Gal: EMap "new*** EMapCT2 13b region 8" in "ArtGallery." This iteration is defined by: x <- y-sgn(x)*sqrt(abs(b%x-c)), y <- a-x*d. Parameters are: a = .2300; b = -4.7000; c = 9.4000; d = 1.1000; EMap CT: 2 Too busy at the center but still interesting.
|
|
|
View/Sys/Gal: EMap "new*** EMapCT2 13b region 9" in "ArtGallery." This iteration is defined by: x <- y-sgn(x)*sqrt(abs(b%x-c)), y <- a-x*d. Parameters are: a = .2300; b = -4.7000; c = 9.4000; d = 1.1000; EMap CT: 2 Nice. Area of viewing region ~ .005.
|
|
|
View/Sys/Gal: EMap "new*** EMapCT5 13b region 10" in "ArtGallery." This iteration is defined by: x <- y-sgn(x)*sqrt(abs(b%x-c)), y <- a-x*d. Parameters are: a = .2300; b = -4.7000; c = 9.4000; d = 1.1000; EMap CT: 5 Colors are not great but image is interesting.
|
|
|
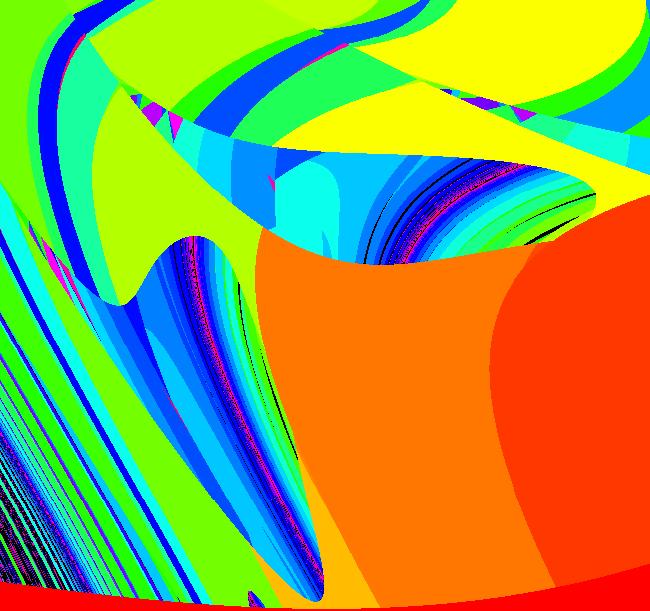
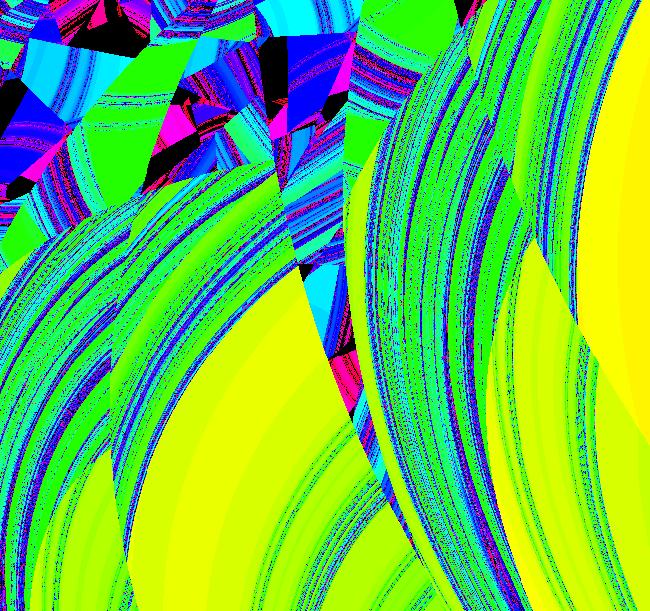
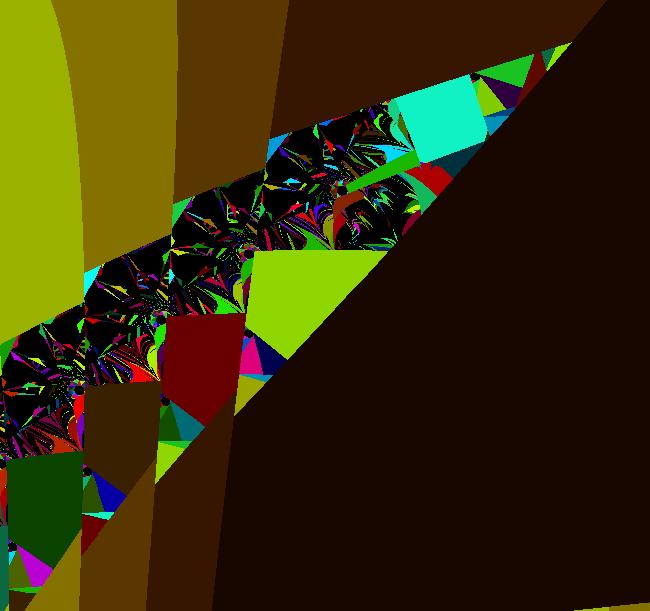
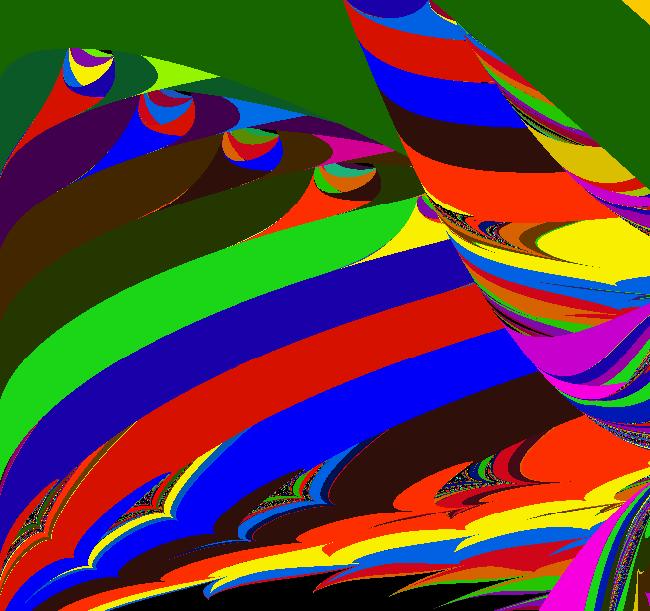
View/Sys/Gal: EMap "new*** EMapCT9 13b region 11" in "ArtGallery." This iteration is defined by: x <- y-sgn(x)*sqrt(abs(b%x-c)), y <- a-x*d. Parameters are: a = .2300; b = -4.7000; c = 9.4000; d = 1.1000; EMap CT: 9 This one is interesting because of the placement of the simple elegant forms. It could easily be done by hand.
|
|
|
View/Sys/Gal: EMap "new*** EMapMaxCT2 13b region 12" in "ArtGallery." This iteration is defined by: x <- y-sgn(x)*sqrt(abs(b%x-c)), y <- a-x*d. Parameters are: a = .2300; b = -4.7000; c = 9.4000; d = 1.1000; EMap CT: 2 A bit busy. Area of viewing region ~ .000005.
|
|
|
View/Sys/Gal: EMap "new*** EMapMaxCT2 13b region 13" in "ArtGallery." This iteration is defined by: x <- y-sgn(x)*sqrt(abs(b%x-c)), y <- a-x*d. Parameters are: a = .2300; b = -4.7000; c = 9.4000; d = 1.1000; EMap CT: 2 Area of viewing region ~ .08. A rather large viewing region but interesting content.
|
|
|
View/Sys/Gal: EMap "new*** EMapMaxCT2 13b region 14" in "ArtGallery." This iteration is defined by: x <- y-sgn(x)*sqrt(abs(b%x-c)), y <- a-x*d. Parameters are: a = .2300; b = -4.7000; c = 9.4000; d = 1.1000; EMap CT: 2 Busy but interesting content.
|
|
|
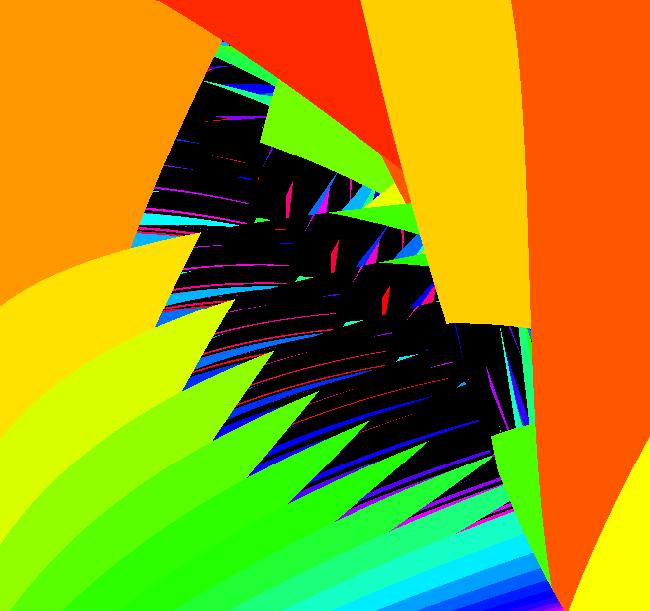
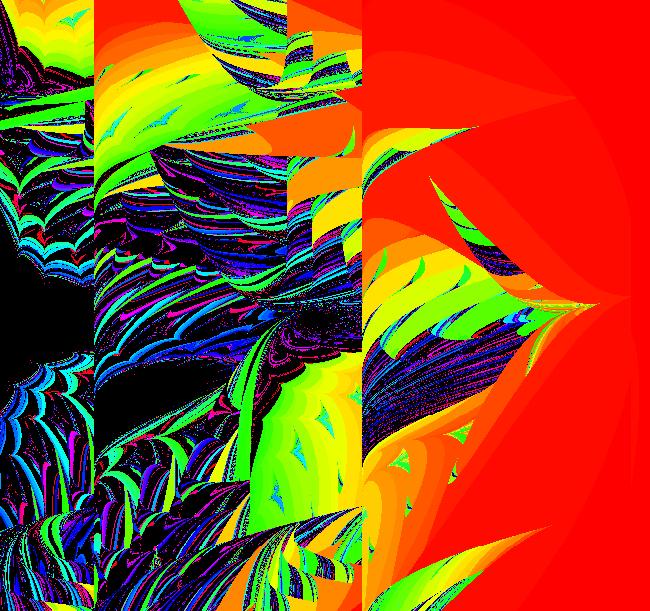
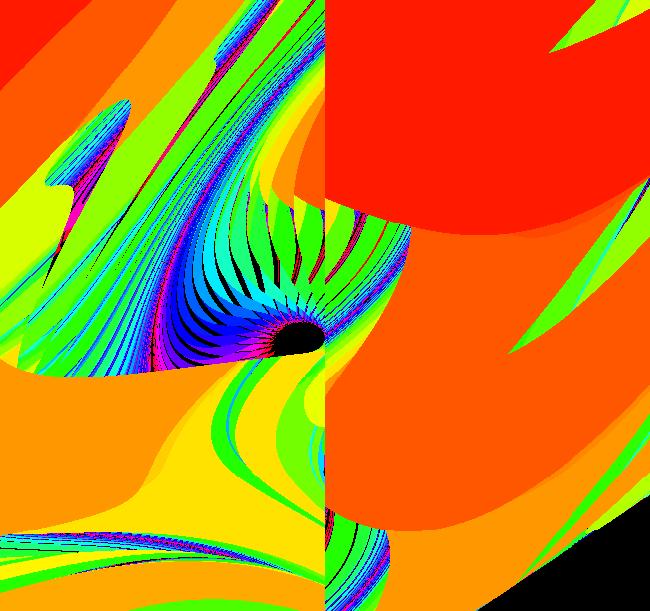
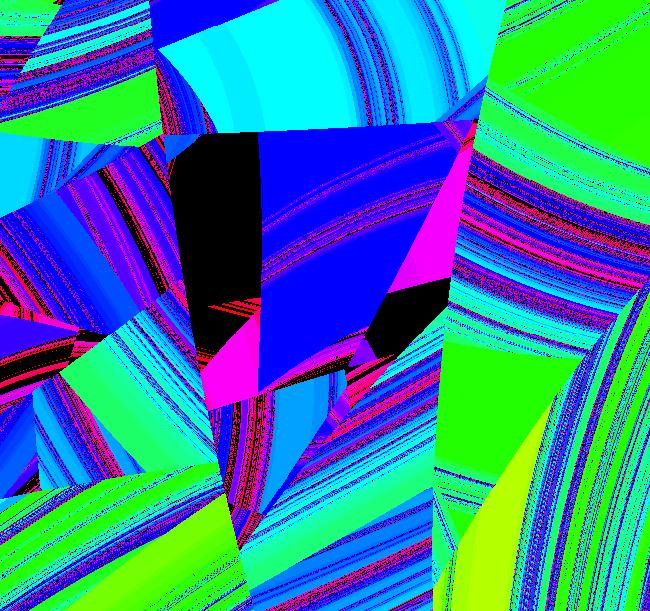
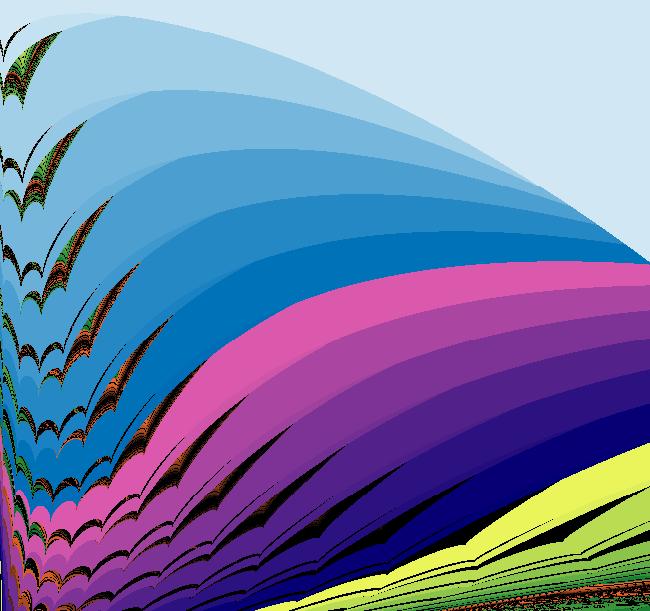
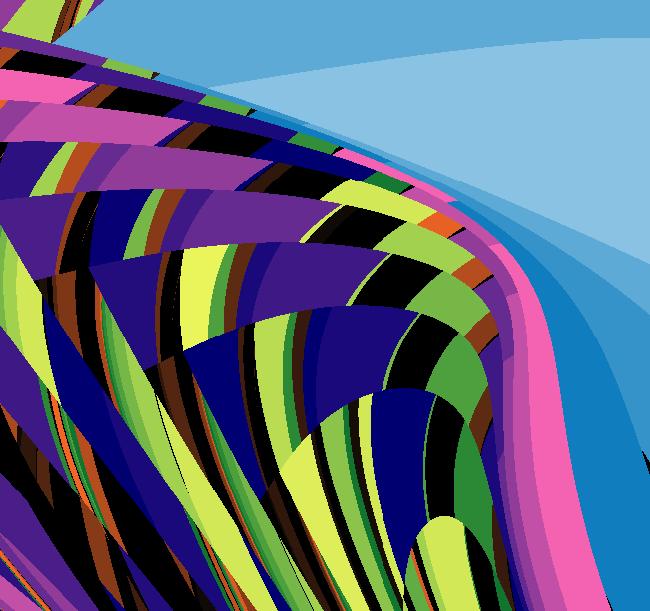
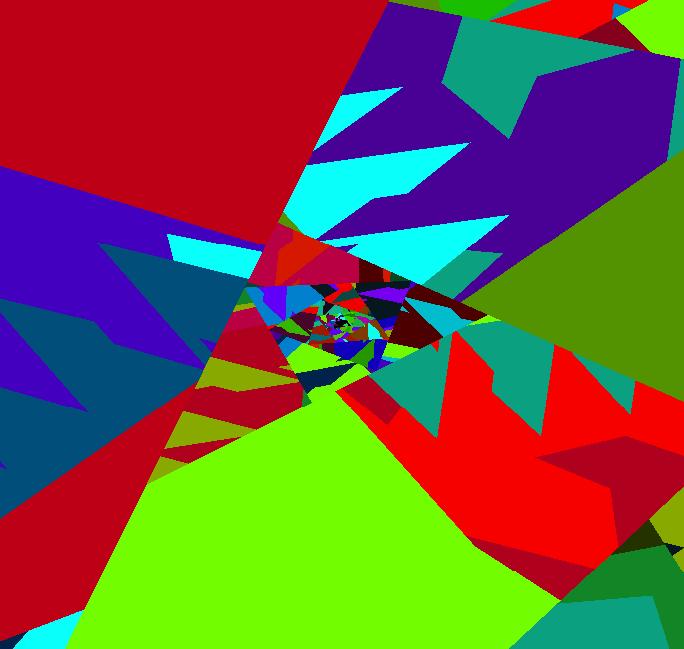
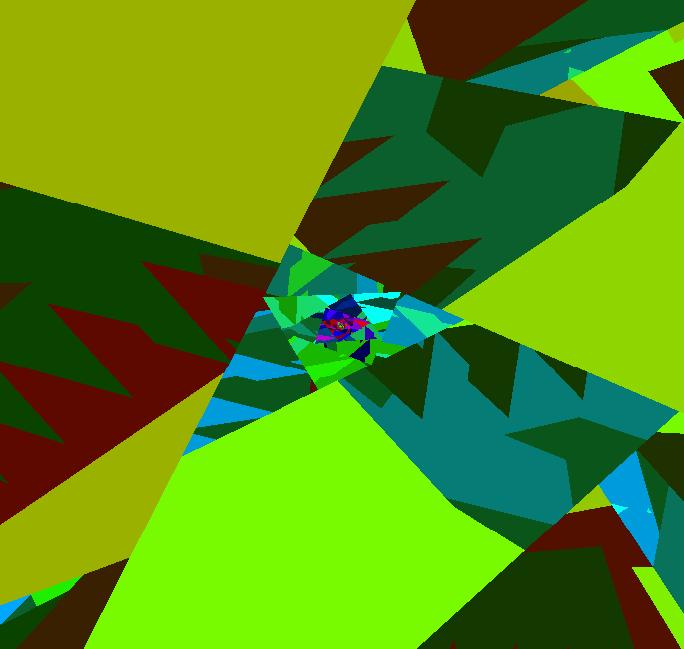
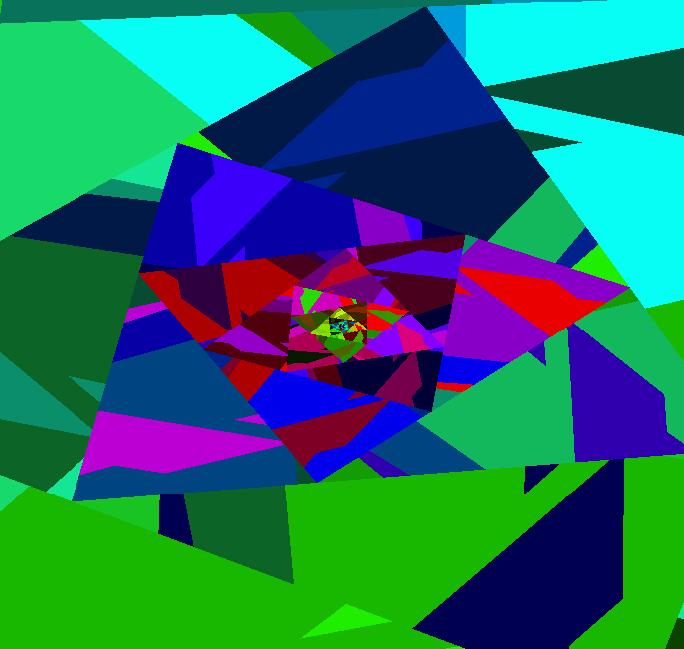
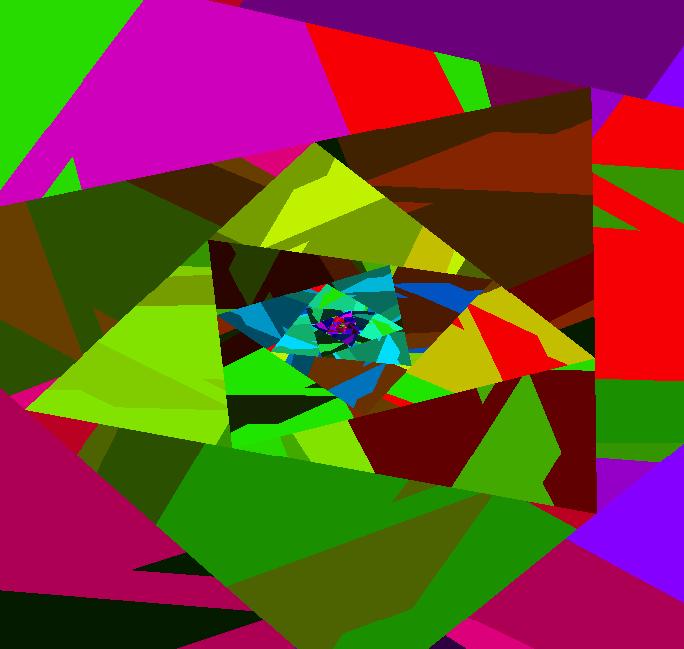
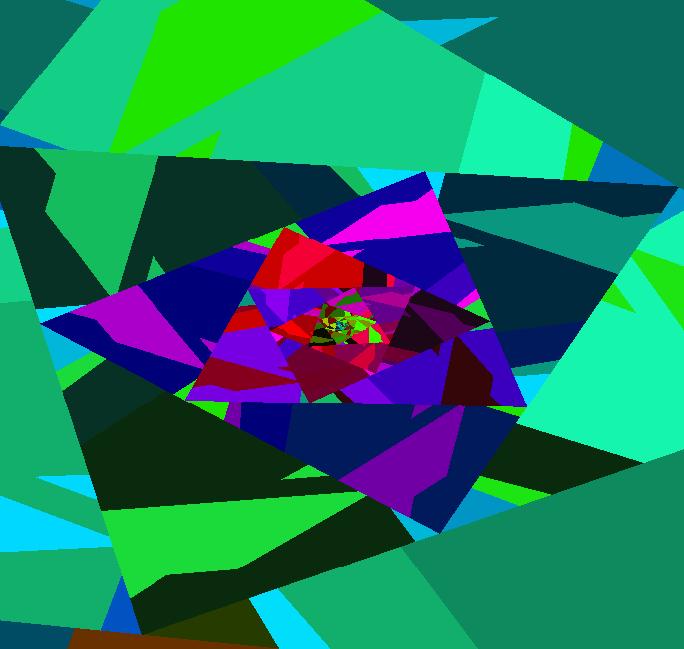
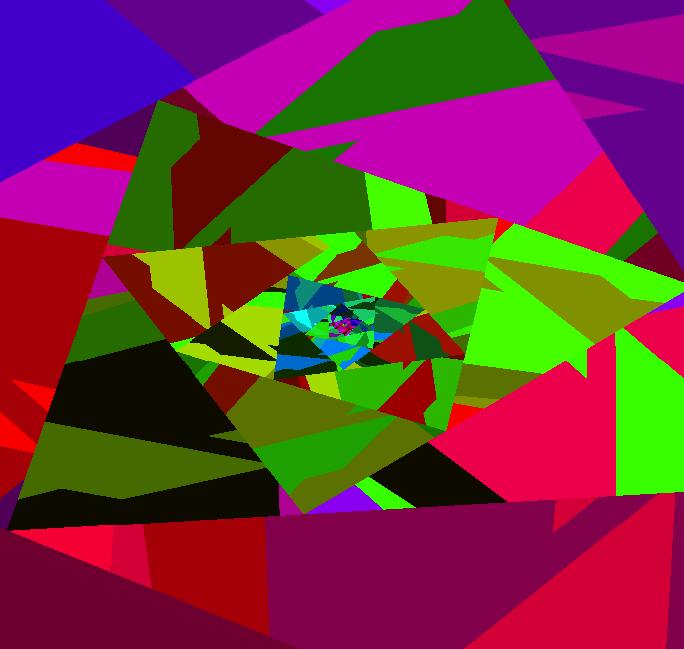
View/Sys/Gal: EMap "new*** EMapMaxCT2 13b region 15" in "ArtGallery." This iteration is defined by: x <- y-sgn(x)*sqrt(abs(b%x-c)), y <- a-x*d. Parameters are: a = .2300; b = -4.7000; c = 9.4000; d = 1.1000; EMap CT: 2 This one is actually an interesting fractal centered at about (1.6430418,5.4168280). If you zoom in 5 times you get similar images that differ in detail while the area of the viewing region goes from about 2/10^2 to 2/10^10. Image 1: 1st image Image 2: 1st image zoomed-in 1X Image 3: 1st image zoomed-in 2X |
|
|
View/Sys/Gal: EMap "new*** EMapMaxCT2 13b region 15" in "ArtGallery." This iteration is defined by: x <- y-sgn(x)*sqrt(abs(b%x-c)), y <- a-x*d. Parameters are: a = .2300; b = -4.7000; c = 9.4000; d = 1.1000; EMap CT: 2 This one is actually an interesting fractal centered at about (1.6430418,5.4168280). When you zoom in 5 times you get similar images that differ in detail while the area of the viewing region goes from about 2/10^2 to 2/10^10. Image 1: 1st image Image 2: 1st image zoomed-in 1X
|
|
|
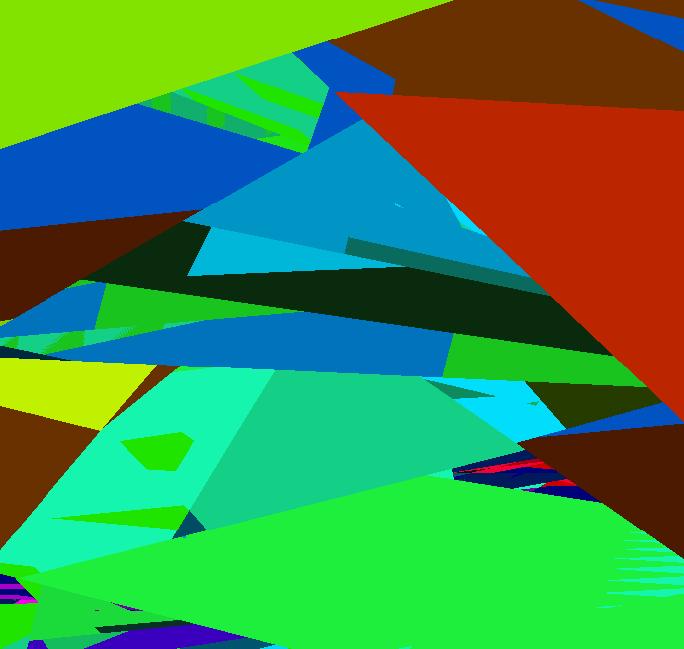
View/Sys/Gal: EMap "new*** EMapMaxCT2 13b region 16" in "ArtGallery." This iteration is defined by: x <- y-sgn(x)*sqrt(abs(b%x-c)), y <- a-x*d. Parameters are: a = .2300; b = -4.7000; c = 9.4000; d = 1.1000; EMap CT: 2
|
|
|
View/Sys/Gal: EMap "new*** EMapMaxCT5 13b region 17" in "ArtGallery." This iteration is defined by: x <- y-sgn(x)*sqrt(abs(b%x-c)), y <- a-x*d. Parameters are: a = .2300; b = -4.7000; c = 9.4000; d = 1.1000; EMap CT: 5
|