|
An OdeFactory Slide Show
Click on a slide to zoom in.
Click "video" to see a video. |
View/Sys/Gal: Ode " Overview of the 3D View in OdeFactory" in "3DViewExs."
Range: (vMax,vMin) = (5.000,-5.000), (hMin,hMax) = (-5.000,5.000)
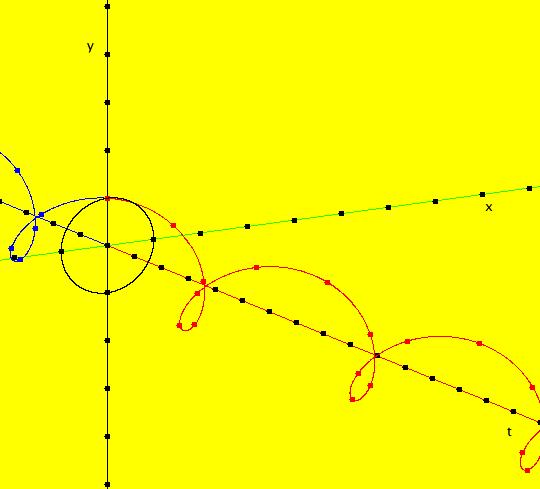
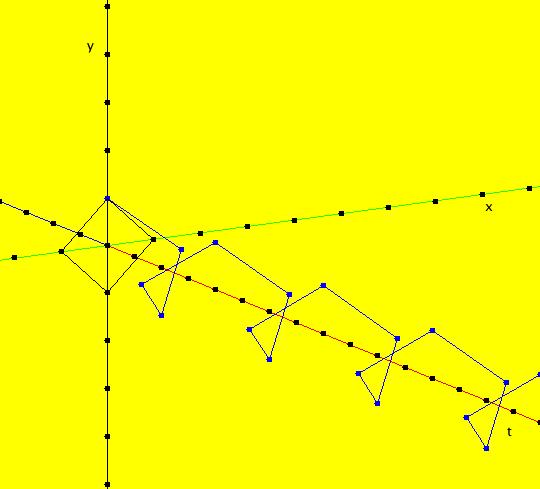
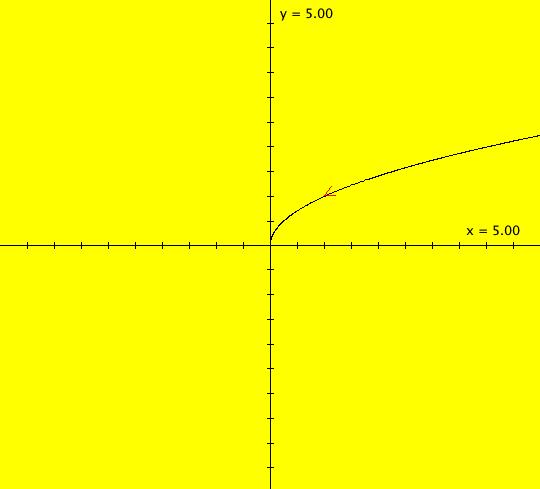
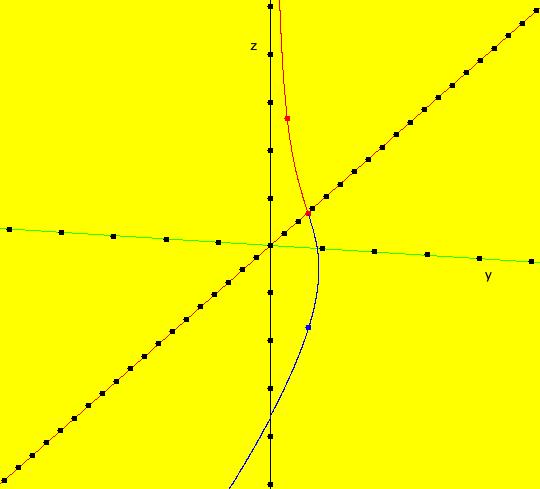
VFld: (0) ~~~~~~ Overview of 3D Views ~~~~~~ The examples in this gallery demonstrate features of the automatically generated auxiliary 3D view in OdeFactory. The 3D view is used primarily to study 2D systems of odes but it can also be used to study 2D iteration maps and 3D and 4D systems of odes. ~~~~~~ Setting ICs ~~~~~~ Which pair of the five buttons below the graphics area: t, x, y, z, and w you have selected determines how the ICs for a system are set. For example, if you have a 2D system and you have selected buttons x and y, you can set ICs: (t0,x0,y0), (t0,x1,y1), (t0,x2,y2), ... This is called the "(x,y) view" of the 2D system. If you select buttons t and x, you can set ICs: (t0,x0,y0), (t1,x1,y0), (t2,x2,y9), ... This is called the "(t,x) view" of the 2D system. The "3D view" of a system is only available for "(b1,b2) views" of a system where b1 and b2 are names of phase space variables: x, y, z and w. ~~~~~~ Ode View of 2D Systems in 3D ~~~~~~ The names "Ode view", "IMap view" and "EMap view" refer to the three different algorithms than can be used to generate images. For 2D systems there is only one 3D view called the (t,x,y) view. When there are trajectories defined in the phase space view (x,y), selecting t, in addition to x and y, opens the 3D view of the corresponding solution curves in the extended phase space (t,x,y). Trajectories defined in the 2D (t,x) and (t,y) views are not included in the 3D view, however, the 3D/(t,x) and 3D/(t,y) subviews show the x(t) and y(t) function for the trajectories defined in the 2D (x,y) view. An orientation controller for the 3D view opens when you click in the 3D viewing area. The 3D view of a 2D system has four default orientations: 3D/(t,x,y), 3D/(x,y), 3D/(t,x) and 3D/(t,y). The last three are projections of solution curves onto the (x,y), (t,x) and (t,y) planes respectively. The 3D/(t,x,y) view shows the solution curve, in 3D, and the (black) projection of the solution curve (the trajectory) onto the phase space. The red part of solution curves in the 3D view indicate the +t direction and the blue part indicates the -t direction. The dots on the curves are 1 time unit apart. The (t,x,y) coordinate system is right handed. The t axis is red, the x axis is green and the y axis is black. ~~~~~~ IMap View of 2D Systems in 3D ~~~~~~ When you view a 2D system as an IMap, orbits in the 2D (x,y) view consist of a sequence of small dots. The start of an orbit, or the orbit's seed, is indicated by a black dot. You can have OdeFactory connect the dots, so you can see the orbit dot-sequence, by selecting "Show 2D IMap Orbit Sequence" on the Settings menu. The orbit's points are then connected. Individual orbits have line segments that are colored. Orbits are colored blue, red, green, magenta and black. When there are more than five orbits in an image, the five colors are reused. In the 3D view, IMap dots are automatically connected by straight line segments so you can see the sequence of iterates. There is no "-t" iteration for an IMap so there are no red/blue parts of orbits. ~~~~~~ Miscellaneous Considerations ~~~~~~ Parameter controllers apply to all 3D views. There is no 3D view for EMaps. OdeFactory automatically generates the position and scale of the first two 3D axes from the position and scale of the associated 2D horizontal axis. ~~~~~~ 3D Systems ~~~~~~ For 3D systems there are four 3D views. You can open a 3D view for the following triples of the variables: (t,x,y), (t,x,z), (t,y,z) and (x,y,z). As was the case with 2D systems, solutions started in 2D (t,*) views (called time-series views) are not included in 3D views. If you open one of the three 3D (t,a,b) views, only trajectories from the corresponding 2D (a,b) view are shown. If you open the 3D (x,y,z) view, all trajectories from the projected 2D phase space views, (x,y), (x,z) and (y,z), are displayed in the 3D view. The 3D (x,y,z) view is a view of the 3D phase space. ~~~~~~ 4D systems ~~~~~~ For 2D systems the 3D (t,x,y) view shows the extended phase space and for 3D systems the 3D (x,y,z) view shows the phase space. In the case of 4D systems, none of the possible 3D views has any special significance. However, OdeFactory does implement six 3D views of the form (t,a,b) for 4D systems. ~~~~~~ Sample Systems ~~~~~~ Examples of using the 3D view for 2D, 3D and 4D systems follow.
|
|
|
View/Sys/Gal: Ode "2D sys: (a*y,-b*x), a=1; b=1" in "3DViewExs."
Range: (vMax,vMin) = (5.000,-5.000), (hMin,hMax) = (-2.000,8.000)
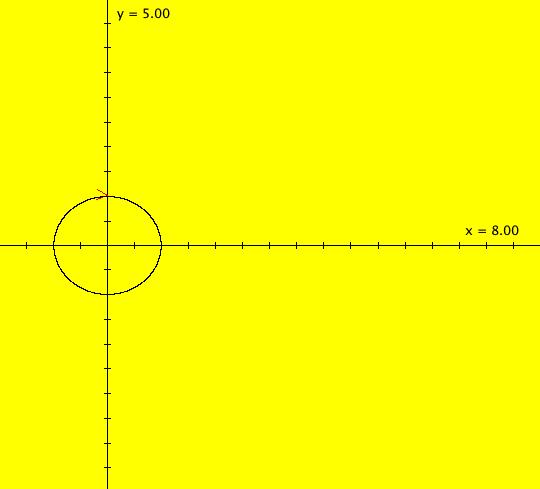
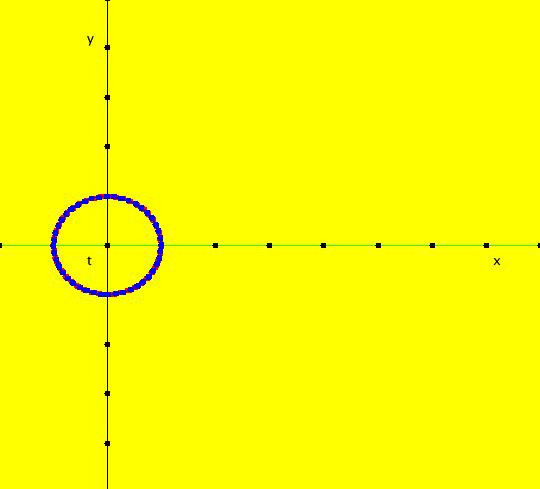
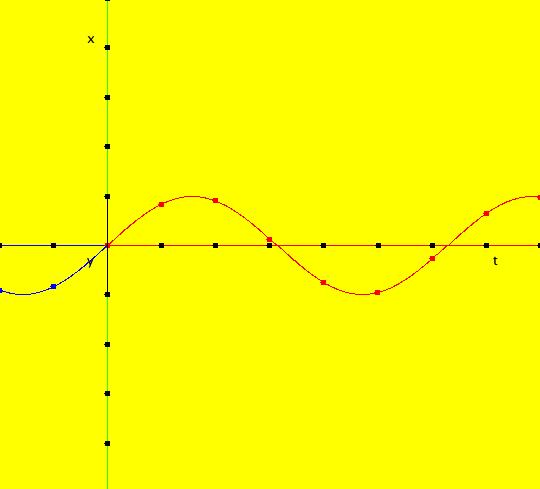
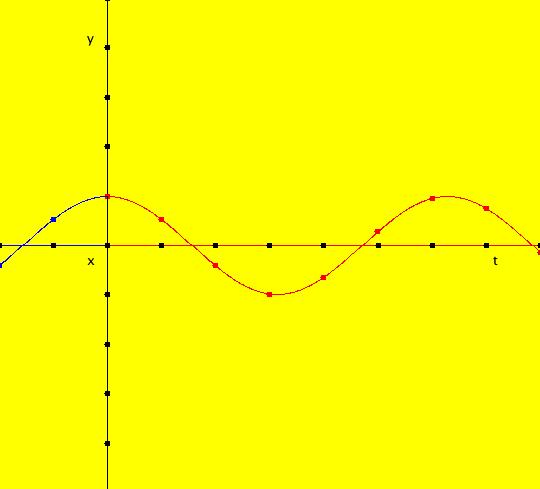
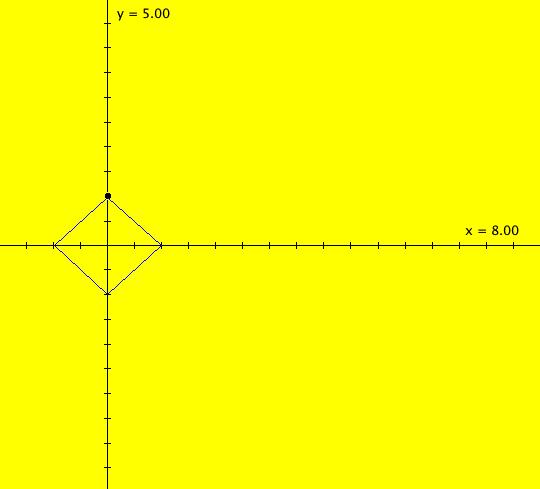
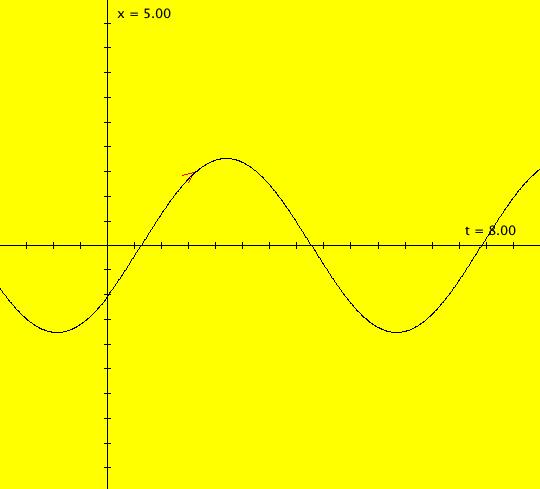
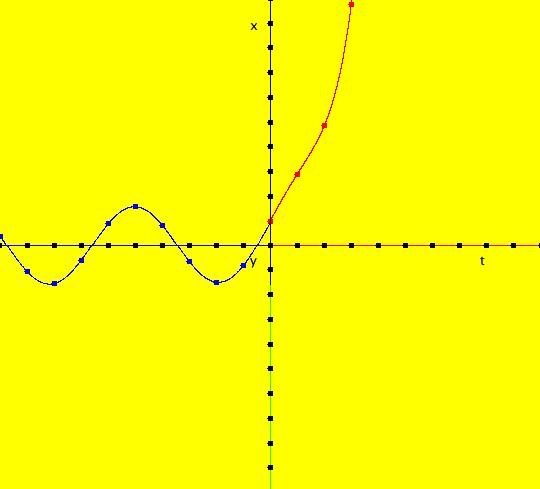
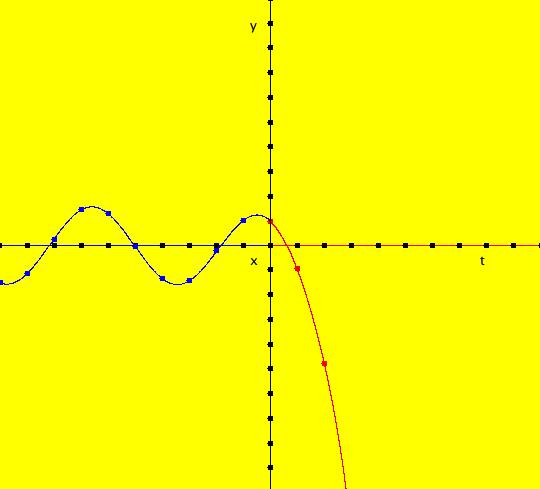
VFld: (a*y,-b*x), a=1; b=1 This system of odes is defined by the equations: dx/dt = a*y, dy/dt = -b*x. Parameters are: a=1; b=1 The 2D (x,y) view has been shifted to the left to move the origin to the left. This makes the t axis longer in the 3D view. In the (x,y) view, there is one trajectory, call it TA, with ICs: (t,x,y) = (0,0,1) or p(0.000000) = (0.000000,1.000000). Image 1: 2D (x,y) view of the Ode. This gives a nice picture of the component functions, x(t) and y(t), in the 3D/(t,x) and 3D/(t,y) subviews respectively. Image 2: 3D/(t,x,y) view of the Ode. Image 3: 3D/(x,y) view of the Ode. Image 4: 3D/(t,x,) view of the Ode. Image 5: 3D/(t,y) view of the Ode. The x(t) function is the projection of the 3D solution curve onto the y = 0 plane. It looks like the sin(t) curve, as expected. The y(t) function is the projection of the 3D solution curve onto the x = 0 plane. It looks like the cos(t) curve, as expected. --> Switch to the IMap view. Turn "Show 2D IMap Orbit Sequence" on. Image 6: 2D (x,y) view of the IMap. Image 7: 3D/(t,x,y) view of the IMap. --> Try adjusting the parameters in the various 3D subviews. --> Get out of the 3D view, add a trajectory at (x,y) = (1,1), switch to the IMap view and get back into the 3D view. Try adjusting the parameters in the various 3D subviews. --> Get out of the 3D view and get into the 2D (t,x) view. In the (t,x) view, one trajectory, call it TB, has been started with ICs: (t,x,y) = (1.600753,1.457086,1.000000) or p(1.600753) = (1.457086,1.000000) The curve in the (t,x) view is the x(t) component of the TB. Image 8: 2D (t,x) view showing TB.
|
|
|
View/Sys/Gal: Ode "3D sys: (a*x,b*y,c*z), a=-2; b=-1; c=1" in "3DViewExs."
Range: (vMax,vMin) = (5.000,-5.000), (hMin,hMax) = (-5.000,5.000)
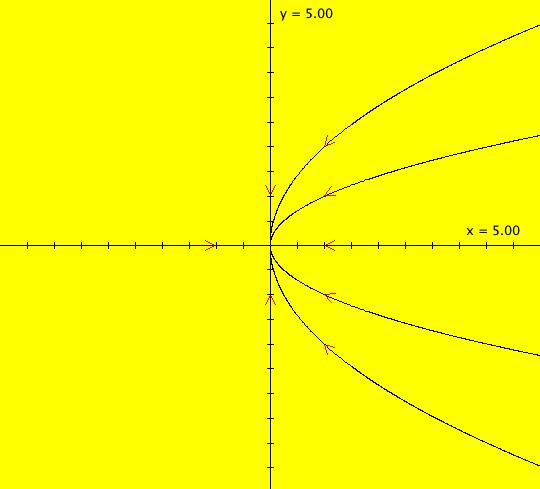
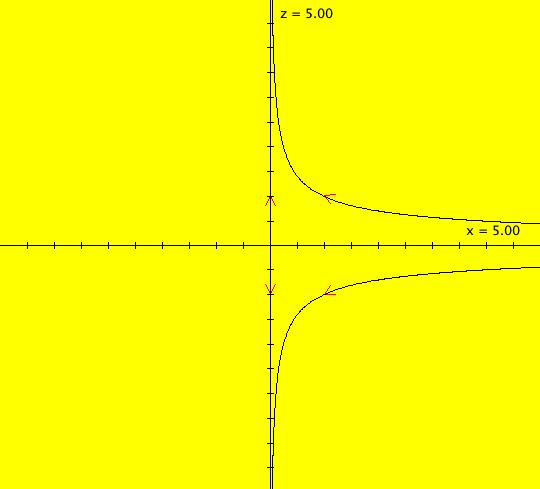
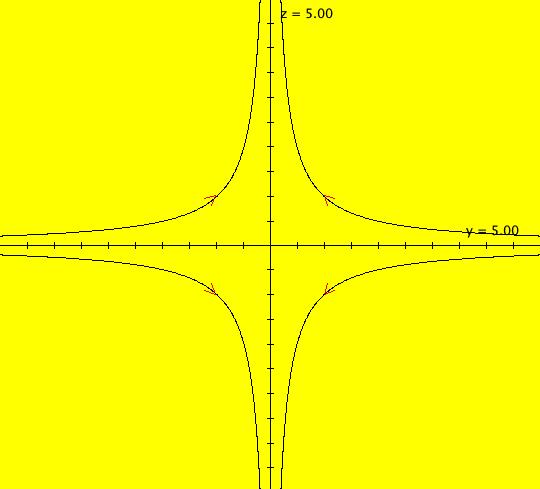
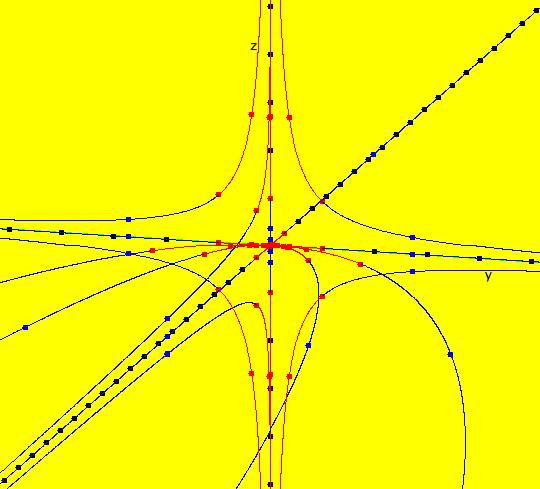
VFld: (a*x,b*y,c*z), a=-2; b=-1; c=1 This system of odes is defined by the equations: dx/dt = a*x, dy/dt = b*y, dz/dt = c*z. Parameters are: a=-2; b=-1; c=1 From V. I. Arnold (ISBN 0-262-51018-9), Fig. 138, p. 140, the λ1 < λ2 < 0 < λ3 case. To see Arnold's figure, get into the 3D/(x,y,z) view and set the Yaw to about -15 degrees. Arnold's coordinates ( ξ1, ξ2, ξ3) correspond to the (x,y,z) coordinates in OdeFactory. For 3D systems in OdeFactory, 2D state-variable views, that is views not involving t, are projections of 3D trajectories from the 3D phase space onto a plane perpendicular to the state variable not in the view. The plane gets defined when you create your first trajectory in the 2D view. All trajectories in the 2D view start in the same plane. For example, in the (x,y) view, your first click in the graphics area will prompt for a z value. A first L-click just prompts for z0 then uses the cursor (pixel) coordinates for (x,y). A first R-click prompts for values for z0 and (x,y). The default for t0 is 0 unless you shift-L/R-click to set a different value For the system under consideration, t0 was defaulted to 0. In the (x,y) view, z = 0 and the trajectory ICs are: (0,+-1), (1,+-1), (2,+-1) and (+-1,0) with t0 = 0. The corresponding solution curves are in the z = 0 plane which is the (x,y) plane. The +z axis is perpendicular out of the computer screen. Image 1: The 8, 2D (x,y) trajectories. In the (x,z) view, y = 0 and the trajectory ICs are: (0,+-1) and (1,+-1) with t0 = 0. The corresponding solution curves are in the y = 0 plane which is the (x,z) plane. The +y axis is perpendicular into the computer screen. Image 2: The 4, 2D (x,z) trajectories. In the (y,z) view, x = 0 and the trajectory ICs are: (+-1,+-1) with t0 = 0. The corresponding solution curves are in the x = 0 plane which is the (y,z) plane. The +x axis is perpendicular out of the computer screen. Image 3: The 4, 2D (y,z) Trajectories. Image 4: The 3D/(t,x,y) view with Yaw = -15, Arnold's Fig. 138, p. 140 image. This is the 3D phase space image which contains all 16 trajectories. A trajectory for this system that does not start in the x = 0, y = 0 or z = 0 planes, for example the trajectory with ICs (x,y,z) = (1,1,1), does not lie in a plane. To see how to draw the (1,1,1) trajectory in OdeFactory, go to ver 2 of this system.
|
|
|
View/Sys/Gal: Ode "3D sys: (a*x,b*y,c*z), a=-2; b=-1; c=1, ver 2" in "3DViewExs."
Range: (vMax,vMin) = (5.000,-5.000), (hMin,hMax) = (-5.000,5.000)
VFld: (a*x,b*y,c*z), a=-2; b=-1; c=1 This system of odes is defined by the equations: dx/dt = a*x, dy/dt = b*y, dz/dt = c*z. Parameters are: a=-2; b=-1; c=1 In this version of the example, the trajectory in the (x,y) view, has ICs (x,y,z) = (1,1,1). It does not lie in any plane. In the (x,y) view the +z axis points out of the screen into your eye. What you are seeing is the projection of the (1,1,1) trajectory onto the (x,y) plane. Image 1: 2D (x,y) view, 1 trajectory at (x,y,z) = (1,1,1). To define this trajectory, get into the (x,y) view, and BEFORE you define any trajectories, R-click in the view. This enables you to set z = 1, rather than the default value z = 0. Any further trajectories that you define in the (x,y) view will then start in the z = 1 plane. In the 3D/(x,y,z) view, set Yaw = -15 to get the trajectory starting in the (+x,+y,+z) octant in Arnold's Fig. 138. Image 2: 3D/(x,y,z) view with Yaw = -15. View the 3D/(x,y), 3D/(x,z) and 3D/(y,z) projections of the trajectory to see that they look correct.
|
|
|
View/Sys/Gal: Ode "4D sys: (y+z,-x,z,w+x)" in "3DViewExs."
Range: (vMax,vMin) = (20.000,-20.000), (hMin,hMax) = (-20.000,20.000)
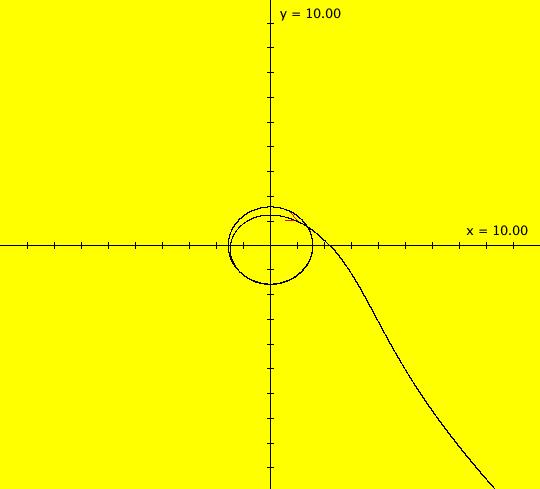
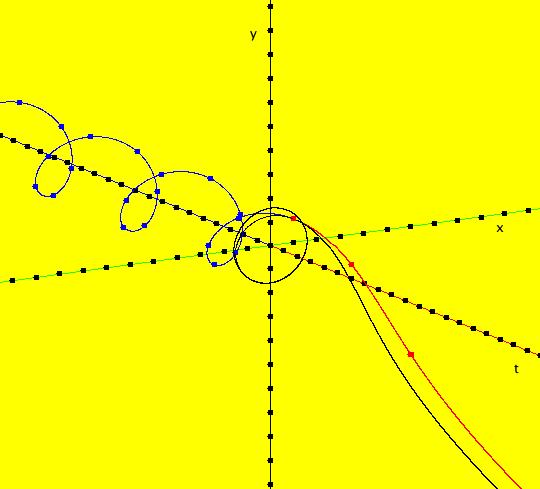
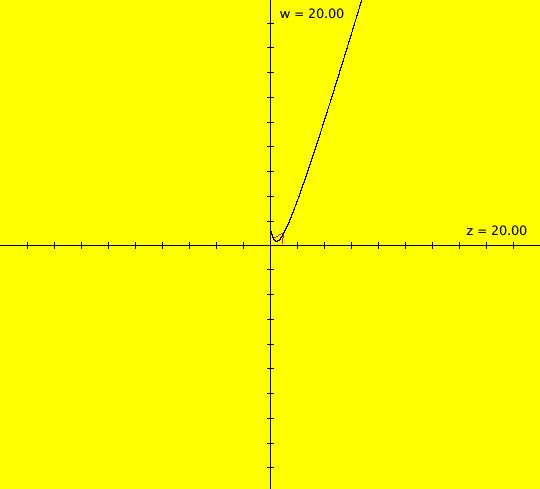
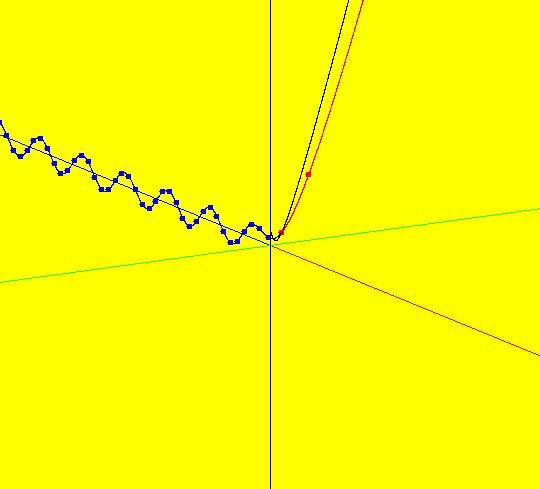
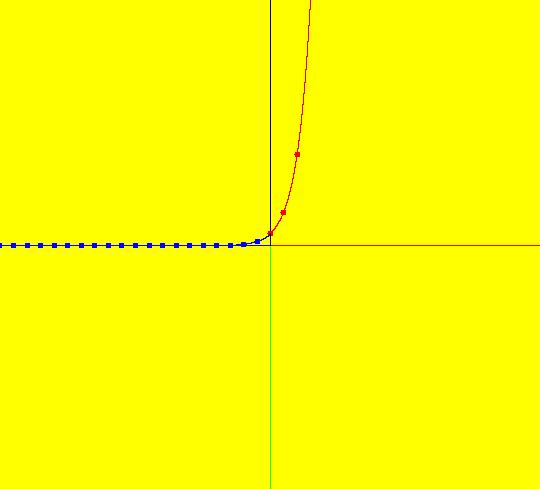
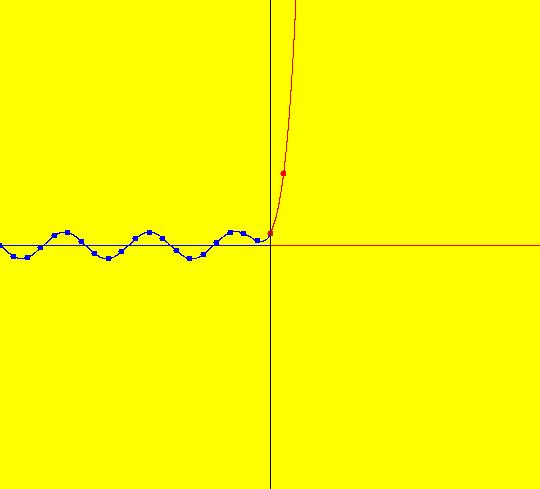
VFld: (y+z,-x,z,w+x) This system of odes is defined by the equations: dx/dt = y+z, dy/dt = -x, dz/dt = z, dw/dt = w+x. 3D views for 4D systems are limited to the six (t,a,b) views in OdeFactory. One way you can make use of the 3D views of 4D systems is to view the components of particular solutions. The 3D/(t,x,y) and 3D/(t,z,w) subviews 3D/(t,x), 3D/(t,y), 3D/(t,z) and 3D/(t,w) show x(t), y(t), z(t) and w(t) provided you use the same ICs in the (x,y) and (z,w) views. For example, set the ICs for the curves in the (x,y) and (z,w) views to: (t,x,y,z,w) = (0,1,1,1,1). View x(t), y(t), z(t) and w(t) by going to the 3D/(t,x,y) and 3D/(t,z,w) views and selecting 3D/(t,x) and 3D/(t,y) in the first case and 3D/(t,z) and 3D/(t,w) in the second case. Image 1: The 4D (x,y) view. Image 2: The 3D/(t,x,y) view of the 4D (x,y) view. Image 3: The 3D/(t,x) view of the 4D (x,y) view. Image 4: The 3D/(t,y) view of the 4D (x,y) view. Image 5: The 4D (z,w) view. Image 6: The 3D/(t,z,w) view of the 4D (z,w) view. Image 7: The 3D/(t,z) view of the 4D (z,w) view. Image 8: The 3D/(t,w) view of the 4D (z,w) view. To check the solution curves, copy/paste the odes and ICs into WA: dx/dt = y+z, dy/dt = -x, dz/dt = z, dw/dt = w+x, x(0) = 1, y(0) = 1, z(0) = 1, w(0) = 1 to get x(t) = 1/4 e^(-i t) ((1+3 i)+(1-3 i) e^(2 i t)+2 e^((1+i) t)), y(t) = 1/4 e^(-i t) ((3-i)+(3+i) e^(2 i t)-2 e^((1+i) t)), z(t) = e^t and w(t) = 1/4 e^(-i t) ((-2-i)-(2-i) e^(2 i t)+2 e^((1+i) t) (4+t)) In WA, double clicking on the right-hand-sides plots the function.
|


